

A Familiar Pattern : Is Ethereum Following in Bitcoin’s Footsteps ?
Technical analysis in financial markets often relies on identifying recurring patterns or fractals. These patterns can provide insights into future price movements. In this context, Coinsprobe recently highlighted an intriguing comparison regarding the current graphical configuration of Ethereum (ETH) on a weekly basis and the bullish cycle that Bitcoin (BTC) experienced between 2018 and 2021. According to this analysis, Ethereum might be replicating the path that led Bitcoin to unparalleled highs.
The model described for Bitcoin at that time included a prolonged accumulation phase followed by a re-accumulation wedge-shaped consolidation. Finally, a final shakeout – coinciding with the global health crisis – before embarking on an explosive ascent. By observing Ethereum’s chart, there is an accumulation phase during the years 2022-2023, followed by the formation of a wedge structure in 2024. The recent V-shaped recovery of ETH’s price, approaching the upper resistance of this wedge, strengthens this analogy. If this similarity is confirmed, ETH could be on the brink of a significant expansion phase.
An Accelerating Trend : ETH is attracting capital once again
The thesis of a potential new all-time high for Ethereum is not solely based on this fractal analysis. The recent performance of the top altcoin is itself a strong indicator of the current bullish momentum. At the time of Coinsprobe’s analysis release, Ethereum had already seen a 60% increase over the last 30 days, trading just above $2,500. This is its highest level in several months. Other sources confirm this trend, even mentioning a surge of over 44% in just three days to surpass $2,600 around May 11.
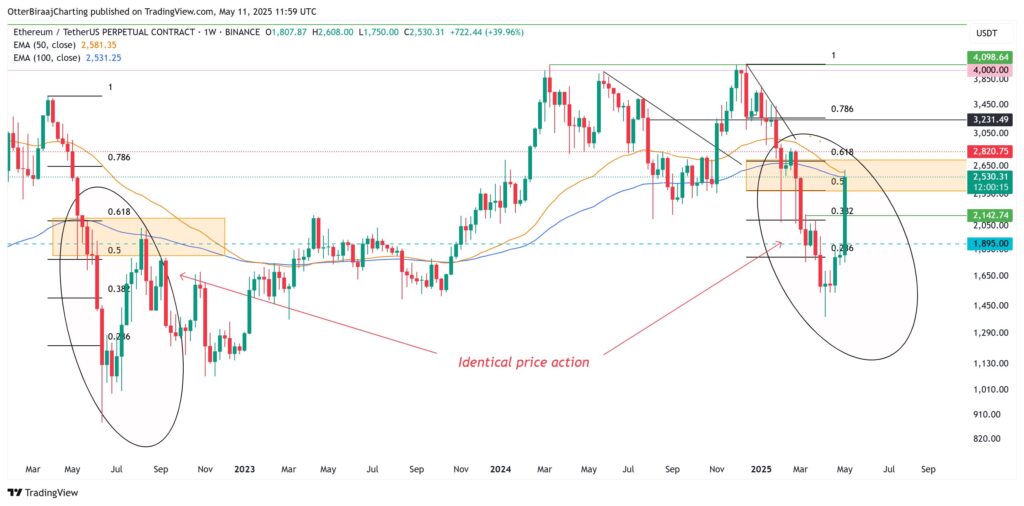
This resurgence of Ethereum comes in a generally positive market environment for cryptocurrencies. Bitcoin, the sector’s locomotive, recently crossed the symbolic threshold of $105,000, nearing its historical peak (around $109,588). This favourable environment, sometimes referred to as the beginning of an “altcoin season,” could provide the ideal conditions for a sustained appreciation of Ethereum. Moreover, some analysts mention positive macroeconomic factors, such as encouraging trade discussions between the U.S. and China.
What Lies Ahead for Ethereum ?
If the fractal model proves to be correct and Ethereum manages to decisively break its major downtrend line, the question arises: how high could the price climb? Coinsprobe’s analysis suggests that, by analogy with Bitcoin’s break of $10,000 in mid-2020, ETH could revisit its previous all-time high (ATH) of around $4,891 (reached in November 2021). Additionally, it could aim for even more ambitious targets, beyond $6,000. Some analysts are even more optimistic, not ruling out a rise towards $10,000 in the medium to long term.
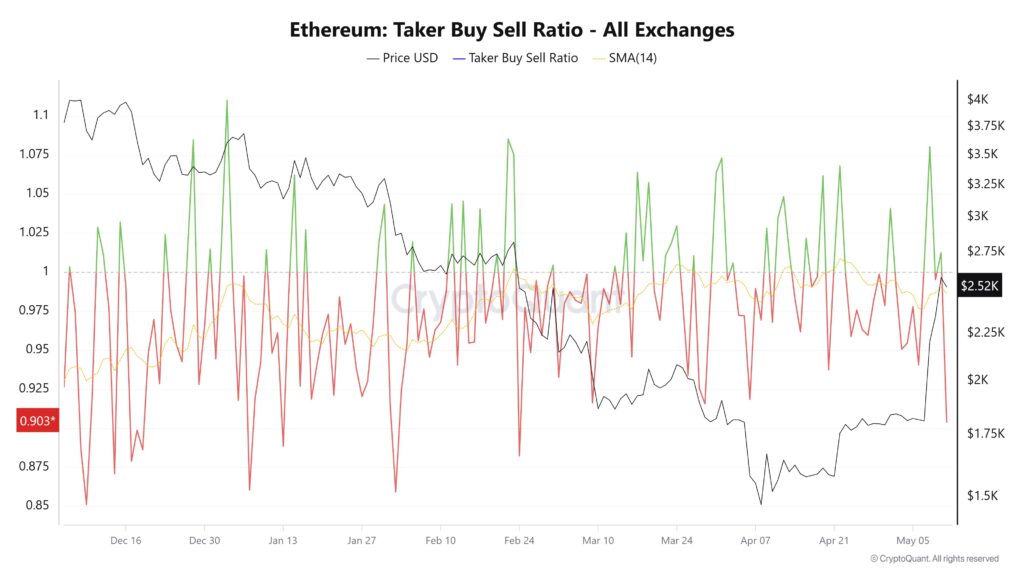
However, before reaching such levels, Ethereum will need to overcome several significant resistances. Technical analysts particularly identify a psychological resistance around $3,000, followed by a swing high level towards $3,600. Surpassing the previous ATH will then be the real test. It is crucial for investors to note that while fractals and technical analyses can provide valuable insights, they never guarantee results.

