

Ethereum’s Bullish Reversal Appears Imminent
Since hitting a low in April 2025 at around $1,400, Ethereum has surged by 32%, reaching $1,807 at the time of writing. This performance positions ETH among the most attractive cryptocurrencies, despite a challenging macroeconomic environment.
The US-China trade war has led to a -0.3% contraction in the US GDP in Q1 2025, the first since Q1 2022, temporarily slowing down the bullish momentum in the markets. However, Ethereum exhibits remarkable resilience, supported by strong technical fundamentals and promising on-chain activity.
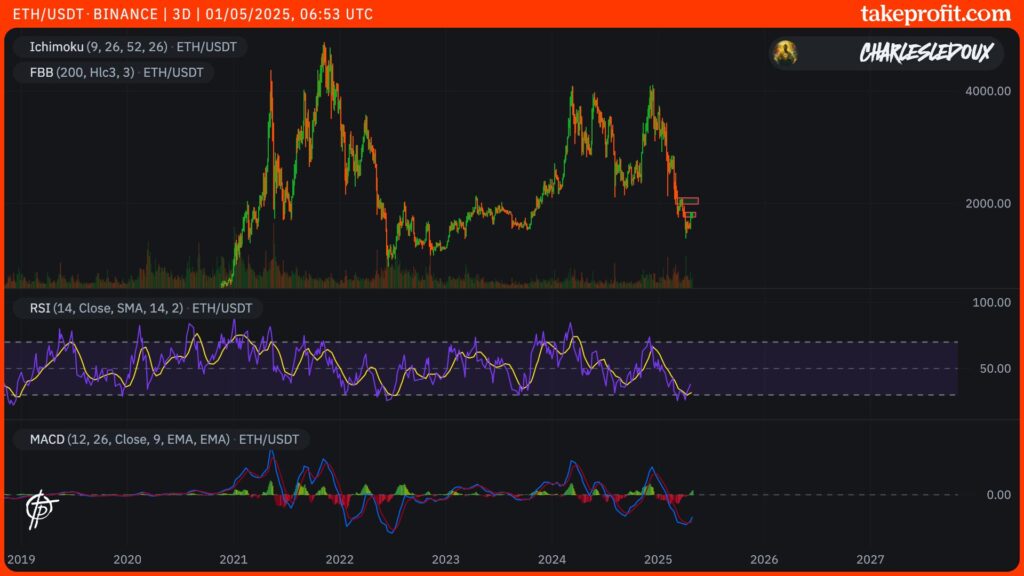
The 3-day Ethereum chart displays a Golden Cross, where the 50-day moving average crosses above the 200-day moving average. This is the first bullish signal of this kind since the post-election rally in November 2024. This cross, particularly significant on higher timeframes, often marks the beginning of a major trend reversal.
Additionally, the MACD on the weekly chart is also nearing a Golden Cross, reinforcing the bullish sentiment.
Another key indicator is the RSI, which has bounced back from the oversold zone at 30, a typical level for local lows where sellers exhaust. This dynamic suggests that ETH could soon test key resistance levels.
Successful Break above $1,600 Resistance
After several tests of the psychological barrier of $1,600, Ethereum has managed to break through it convincingly. This breakthrough, coupled with increasing trading volumes, is an encouraging sign for investors. Confirming this support opens the door to testing the resistance zone around $1,918, a key level to monitor closely.
Beyond technical signals, the activity of whales reinforces optimism. On-chain data reveals massive purchases of ETH by large holders in the range of $1,600 to $1,700. These accumulations, often precursors to significant uptrends, indicate that institutional investors anticipate an imminent surge. Historically, whale movements have amplified market sentiment, attracting individual investors and fueling rallies.
Technical Analysis : Key Levels to Watch
Currently, ETH remains firmly range-bound between $1,730 and $1,850. According to the FBB, ETH could embark on a more than 10% rise towards the next resistance zone at around $2,018. In the meantime, ETH will need to surpass the one at $1,918.
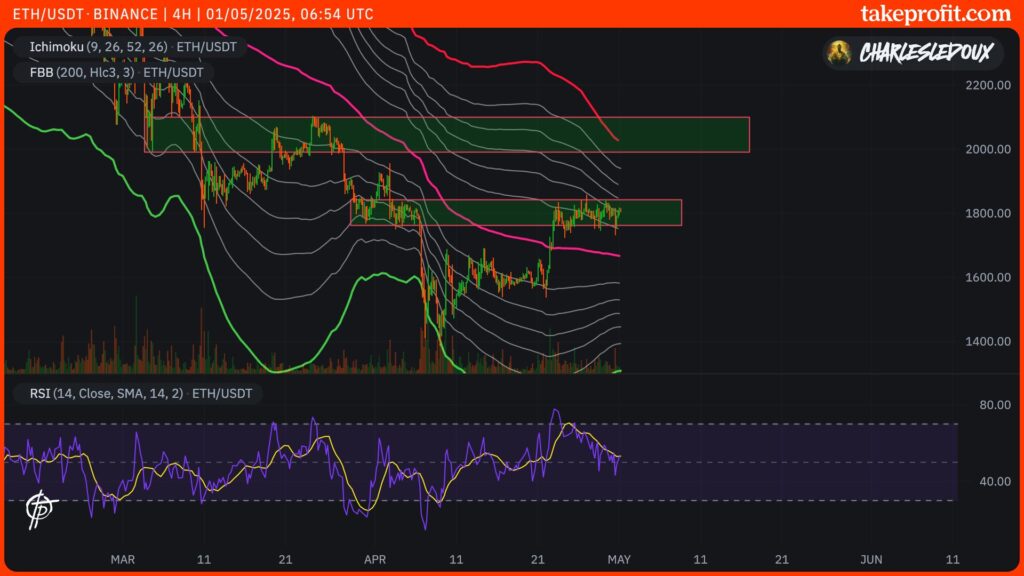
However, risks persist. If the momentum wanes, ETH could drop back to the $1,400 support, which has held the decline over the past four months. A break below this level would invalidate the symmetrical triangle and could lead to a 40% fall towards $1,050. Despite these uncertainties, current technical signals favor further upside. In the short term, ETH has a support at $1,660, the FBB’s 4H midpoint line.
In other words, ETH could surge between $1,900 and $2,050 in the coming days. If the trend continues, the token may then move between $2,200 and $2,500.
In conclusion, if current technical signals materialize, Ethereum could be on the cusp of a significant bullish move in the coming weeks. With a critical support breached and encouraging technical indicators, crypto investors would be wise to keep a close eye on the market’s evolution. If you’re looking to buy ETH, here’s a guide on purchasing it on Bitget :
- Create a Bitget account – Sign up on Bitget’s website with your email or phone, validate the code sent, and activate 2FA to secure your account.
- Verify your identity (KYC) – Submit an ID document to complete the KYC verification, necessary for trading.
- Add funds – Deposit cryptocurrencies (USDT, BTC) or fiat via credit card (Visa, Mastercard) or bank transfer in the “Deposit” section.
- Access the ETH market – Go to the “Spot Market,” search for “ETH,” and select the ETH/USDT pair.
- Make the purchase – Choose a market order (immediate purchase) or limit order (fixed price), specify the quantity, and confirm.

