Ethereum Price Surge Explained : What’s Driving Today’s Rise ?
Ethereum (ETH) surged by 7% on June 10, driven by key factors such as sustained ETF fund flows and record open interest.


Ethereum (ETH) surged by 7% on June 10, driven by key factors such as sustained ETF fund flows and record open interest.
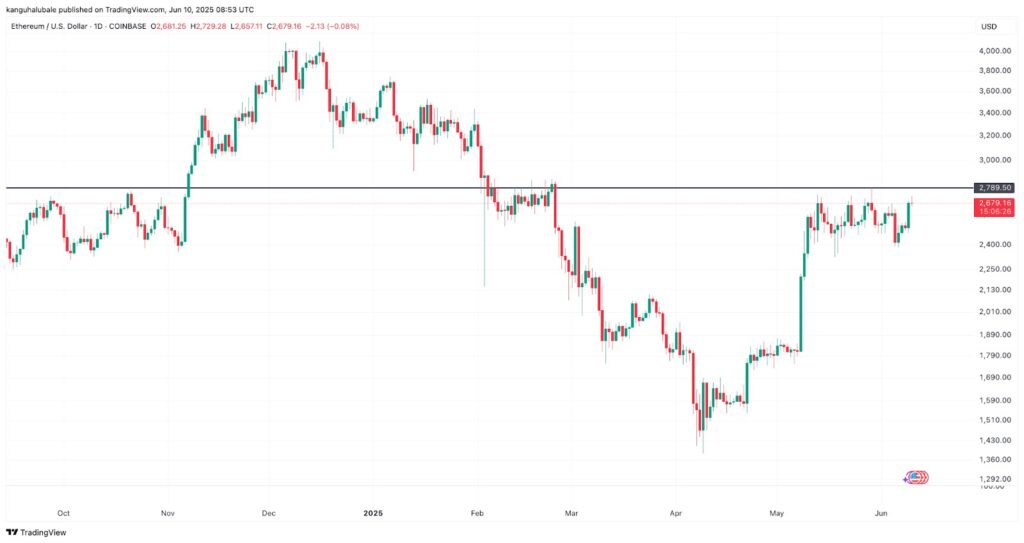
Ethereum saw its price surge over 7% on June 10th to reach $2,679. This increase can be attributed to several key factors, starting with the continuous flows from Ethereum-based Exchange-Traded Funds (ETFs).
Global investment products related to ETH recorded $295.4 million in net flows last week. This marks the seventh consecutive week of positive inflows, bringing the total to $1.5 billion since the beginning of the year. This consistent flow of investments signifies a renewed institutional interest in Ethereum, increasingly viewed as the “infrastructure layer” of digital assets.
Furthermore, spot Ether ETFs, led by iShares, registered $52.7 million in inflows on June 9th, with 16 consecutive days of net collections amounting to $890 million. This momentum indicates a “sentiment shift” among investors towards ETH products, as noted by trading firm QCP.
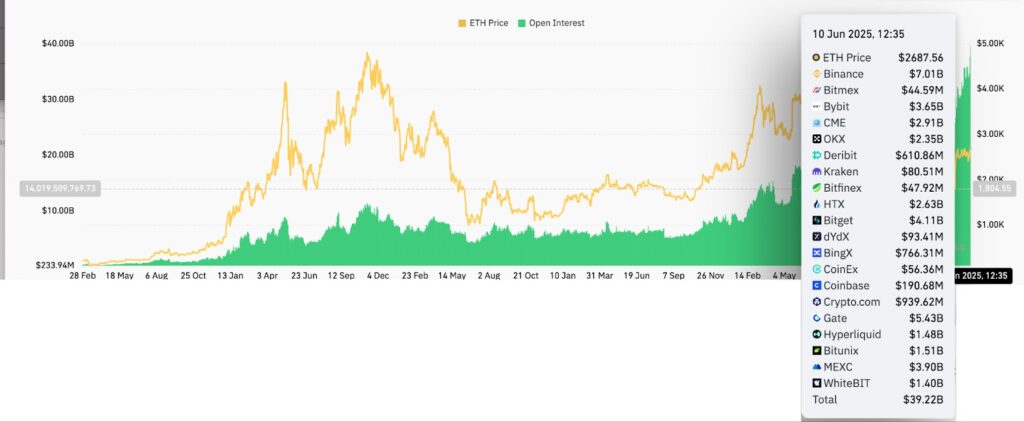
The surge in open interest on futures contracts significantly contributed to Ethereum’s rise. On June 10th, open interest reached a record level of $39.22 billion, up by 12.7% in 24 hours. This suggests that large investors are positioning themselves for a potential rally towards $3,000.
Additionally, funding rates for ETH perpetual futures markets have risen from 0.0026% to 0.0070% over the past two days. This increase indicates that more traders are betting on Ether appreciation and are willing to pay to maintain their long positions open.
Collectively, these indicators reflect a marked bullish momentum in the Ethereum market, with increased investor appetite for this cryptocurrency.
From a technical perspective, ETH/USD has formed a “cup and handle” pattern on its daily chart since February 3rd. This chart pattern, known for its bullish signals, is on the verge of breaking the resistance at $2,789.
If this breakthrough is confirmed, it could pave the way for a technical target above $4,100, representing a potential increase of over 50% from current levels. Several analysts, such as Michael van de Poppe from MN Capital, share this positive perspective on Ethereum.

Gaston has been a writer for over 7 years and a passionate cryptocurrency enthusiast since 2020. He loves exploring the crypto ecosystem and is now dedicated to sharing his insights and discoveries through InvestX.
DISCLAIMER
This article is for informational purposes only and should not be considered as investment advice. Trading cryptocurrencies involves risks, and it is important not to invest more than you can afford to lose.
InvestX is not responsible for the quality of the products or services presented on this page and cannot be held liable, directly or indirectly, for any damage or loss caused by the use of any product or service featured in this article. Investments in crypto assets are inherently risky; readers should conduct their own research before taking any action and invest only within their financial means. This article does not constitute investment advice.


Risk Warning : Trading financial instruments and/or cryptocurrencies carries a high level of risk, including the possibility of losing all or part of your investment. It may not be suitable for all investors. Cryptocurrency prices are highly volatile and can be influenced by external factors such as financial, regulatory, or political events. Margin trading increases financial risks.
CFDs (Contracts for Difference) are complex instruments with a high risk of rapid capital loss due to leverage. Between 74% and 89% of retail investor accounts lose money when trading CFDs. You should assess whether you understand how CFDs work and whether you can afford to take the high risk of losing your money.
Before engaging in financial or cryptocurrency trading, you must be fully informed about the associated risks and fees, carefully evaluate your investment objectives, level of experience, and risk tolerance, and seek professional advice if needed. InvestX.fr and the InvestX application may provide general market commentary, which does not constitute investment advice and should not be interpreted as such. Please consult an independent financial advisor for any investment-related questions. InvestX.fr disclaims any liability for errors, misinvestments, inaccuracies, or omissions and does not guarantee the accuracy or completeness of the information, texts, graphics, links, or other materials provided.
Some of the partners featured on this site may not be regulated in your country. It is your responsibility to verify the compliance of these services with local regulations before using them.
