

Decentralized GPU: The Market Captured by RENDER
Render Network provides a decentralized solution to the structural shortage of GPU capacity created by the explosion of generative AI. NVIDIA cannot produce enough H100 and B200 chips to meet a demand that doubles every six months. Hyperscalers like AWS, Google Cloud, and Microsoft Azure are showing wait times of several weeks. The protocol connects operators of underutilized GPUs with clients needing computing power for visual rendering, model training crypto AI, and real-time inference. Pricing is conducted in token RENDER, and the burn is mechanical with each network transaction.
Network metrics validate this thesis in a concrete manner. Token burns have increased by +278% year-over-year. AI workloads now account for 35 to 40% of network activity, compared to a majority of traditional 3D rendering eighteen months ago. The integration of the Salad network via governance vote RNP-023 has added 60,000 enterprise-grade GPUs to the available pool. The estimated burn from this integration reaches $4.3 million in the first year. These figures confirm that RENDER is capturing an increasing share of a market that is structurally growing with the adoption of AI.
This is not a whitepaper promise. It is a fundamental analysis supported by measurable real-time metrics on the blockchain. The crypto trend towards assets with proven utility and deflationary tokenomics plays directly in favor of RENDER. The Web3 of AI infrastructure finds its most concrete expression here. In a market seeking assets with real utility, RENDER ticks all the boxes.
On-Chain Data from May 27: What the Market is Hiding
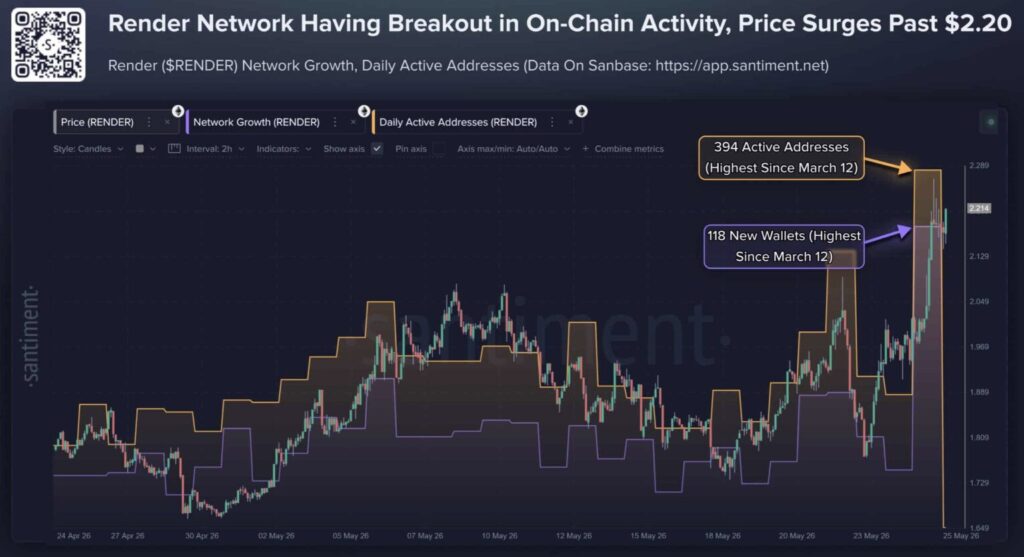
The metrics published by Santiment Intelligence and CoinGlass reveal an instructive setup. Active addresses surged to 394 with 118 new wallets created simultaneously, both metrics hitting their highest in 12 weeks. This coincidence is not trivial: the price increase is attracting real new users to the protocol, not just short-term speculators. This is the most important health signal a project can display. Price growth and usage growth mutually confirm each other.
On the derivatives market side, open interest has increased by +62.7% to $125.2 million, while derivatives volume exploded to $364 million (+166%). The Long/Short ratio stands at 1.8 with 64% of long positions. These figures indicate a clear directional speculation with leverage. A sharply rising open interest in an already extended market is a double-edged sword. It amplifies movements in both directions.
The MVRV Long/Short Difference at -40% (monthly low) signals that recent buyers are profitable and likely to sell to secure their gains. The positive Spot Netflow shows $30 million flowing out of exchanges against $32 million flowing in. Sellers are active, but buyers remain slightly dominant. This setup does not invalidate the bullish trend. It simply indicates a likely consolidation before the next bullish leg.
Falling Wedge Confirmed: Where are the Key Levels?
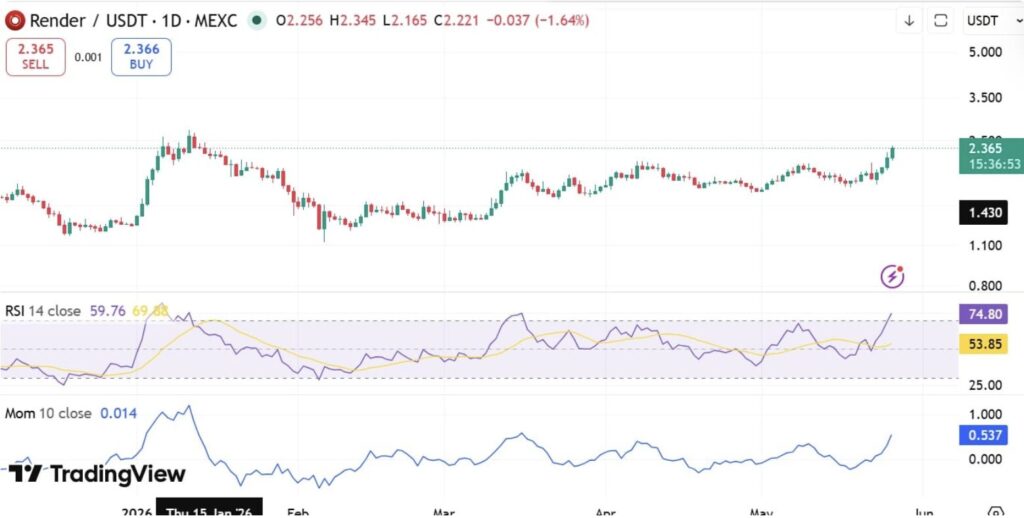
From a charting perspective, RENDER has produced what analysts have been anticipating for weeks: a confirmed falling wedge breakout. Analyst Javon Marks identified this pattern in early May with targets of $3.60 (+54%) and $7.70 (+228%) if momentum confirms. A second analyst projects levels between $3.07 and $13.16 using the same technical structure. At the current price of $2.35, the risk/reward ratio remains attractive for profiles with a 3 to 6-month horizon.
The first defensive support is located at $2.05-2.10, corresponding to the former resistance turned support after the breakout. A return to this area with declining volume would constitute a favorable entry opportunity. The deeper structural support at $1.90 represents the tactical invalidation: a daily close below this level would signal that the breakout was a fakeout. Fibonacci levels place immediate resistance between $2.45-2.50. Beyond that, layered resistance between $2.80 and $3.50 is the major confluence zone.
The RSI at 74 on the daily deserves attention. It is not yet in extreme euphoria territory but justifies avoiding immediate chase entries. Historically on RENDER, an RSI between 70 and 80 accompanied by high volume has preceded consolidations of 5 to 15% before continuation. The MACD shows increasing histograms in positive territory on the daily. The Bollinger Bands are widening upwards, signaling bullish expansion that is not yet exhausted.
Should You Buy RENDER Now or Wait?
At $2.35, the risk/reward ratio is not optimal for a full initial entry. The extended RSI and active profit-taking increase the likelihood of a consolidation towards $2.10-2.20. The rational strategy combines two approaches: an initial reduced position at 30-40% of the target sizing opened on consolidation, and a reinforcement on confirmed breakout above $2.50 on a daily close. Stop loss below $1.90 for the entire position, yielding a risk/reward ratio exceeding 1:3.5 towards the target of $3.60.
If buyers continue to defend the $1.90-2.00 zone as support/resistance, the next expansion phase targets the range of $3.50-5.00. This still represents 50 to 113% potential from current levels. A decisive breakthrough of the layered resistance between $2.80 and $3.50 with volume would open targets at $5.00 and $6.00 on a 2026 horizon. The futures in swing trading represent the most suitable exposure vector for this setup profile.
The investor profile in question is one who understands the decentralized GPU computing thesis, accepts 30-40% volatility along the way, and has a 3 to 6-month horizon. For investors looking to invest in crypto in RENDER, the price forecast remains one of the most documented in the crypto AI segment for this cycle. The crypto bull run of 2025-2026 structurally favors assets with real utility and deflationary tokenomics. RENDER ticks both boxes simultaneously, which remains rare in the current market.
Sources:
Related Articles:

