

WTI Analysis: A Range Under Pressure
After averaging $60 in January and $64.51 in February, a major geopolitical shock propelled the WTI to $112 in March, marking a +42% surge in eight weeks. Since then, however, the WTI has been trending within a clear ascending channel.
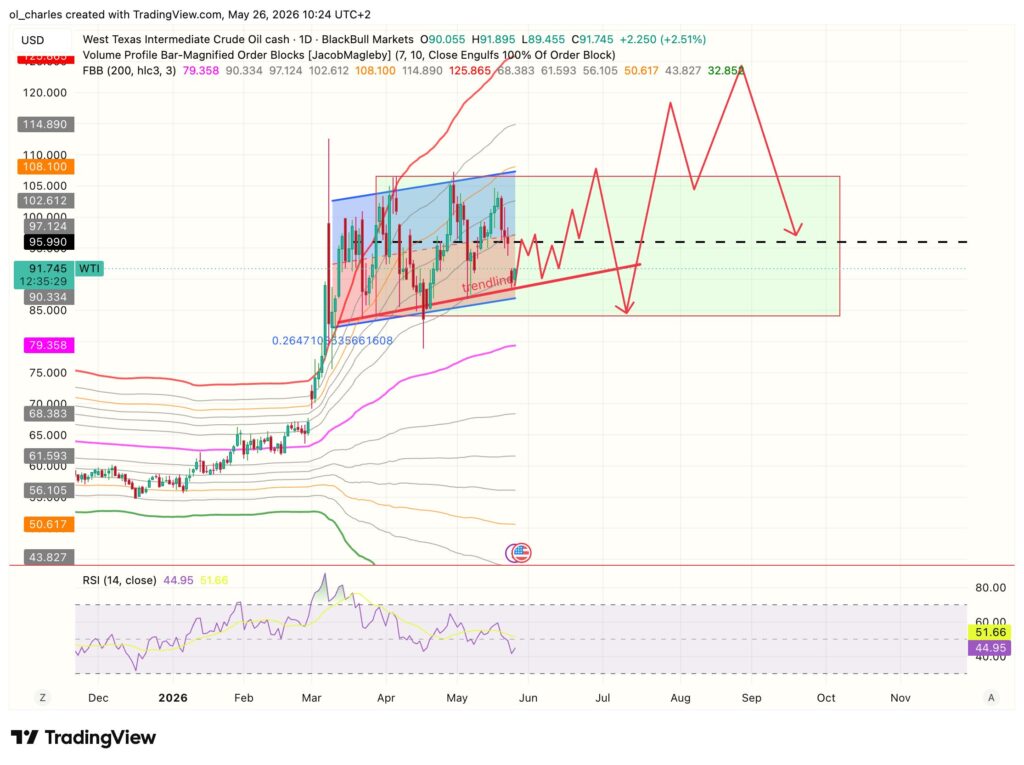
Looking at the daily WTI chart since January 2026, several structures clearly stand out:
1. The range between $84 and $102: This is the range dictating the supports, resistance, and TP/SL for traders. The WTI has a range bottom at $83.90 and a mid range at $96.20. Meanwhile, its high point sits around $107. At the top of the range, we look for a fakeout confirmation to short with a TP at the mid range and range bottom, and vice versa.
2. The bullish channel and active range: Between March and late May, the price moved within a broad ascending channel between roughly $80 and $107. This channel is clearly visible on the chart. Currently, the price finds itself in the lower section of this channel following the bearish triangle breakout. The $90 to $95 zone acts as the dynamic floor for this range.
3. The bullish trendline below the price: Since early March, the WTI has been building liquidity to the downside with a trendline now sitting around $88. A breakdown of this trendline increases in probability as the WTI continues to condition this range.
Key levels to watch closely
The $100 to $107 level represents the first major upside hurdle — aligning with the broken trendline in a classic resistance turned support turned resistance scenario.
In the event of a decisive bearish breakdown, the next significant support sits around $88, followed by the $83.87 zone.
Expert projections
When it comes to experts, banks and agencies are diverging sharply, signaling that oil is currently in a regime of extreme uncertainty:
For instance, Goldman Sachs anticipates Brent at $90 for Q4 2026 (with WTI around $83), Morgan Stanley projects Brent at $110 for Q2, Barclays targets an annual $100 for Brent, and HSBC expects an average of $95.
The US EIA has raised its annual Brent forecast to $96 (WTI at $87.41), up from $73.61 in March prior to the closure of the Strait of Hormuz. The geopolitical risk premium linked to Hormuz is estimated between $8 and $15 per barrel according to analysts.
Basically, if an Iran and US agreement materializes and Hormuz reopens, an $8 to $15 risk premium would mechanically disappear, potentially pushing the WTI toward $80 to $85 in the following weeks.
The X factor: Hormuz as a price switch
The closure of the Strait of Hormuz generated inventory drawdowns of 8.5 million barrels per day in Q2 2026. The EIA attributes the price spike to Middle East production outages exceeding 10 million barrels per day in April.
The key variable is not technical — it is therefore diplomatic. Every tweet from Trump or Iranian statement can move the WTI by 5% to 10% in a single session. In this context, wide stops are not optional, they are mandatory. Everyone in this market is currently playing with massive stops because the news asymmetry is absolute.
In the meantime, oil offers a playground for range traders. Every movement is followed by quick profit taking.
The chart clearly shows a channel compressing to the downside. The symmetrical triangle breakdown on May 25 is the dominant technical signal. Broken support becomes resistance, the 100 SMA crosses below the 200 SMA — the setup favors short term bearish continuation.
However, the backdrop remains geopolitical: as long as the Iran deal remains unsigned and Hormuz stays closed, a risk premium of $8 to $15 remains priced in. The WTI at $92 today is a price synonymous with war rather than a price synonymous with approaching peace.
Sources:
Related Articles:

