Massive inflows into Solana ETFs: Can SOL break $92?
Solana (SOL) sees massive ETF inflows & whale interest. Explore our analysis, price targets, and potential for SOL to break $92. Read now!


Solana (SOL) sees massive ETF inflows & whale interest. Explore our analysis, price targets, and potential for SOL to break $92. Read now!
The crypto market is holding its breath in the face of the current dynamics. While Solana (SOL) is currently trading in a range between $85.50 and $86.50, an underlying force is catching the attention of institutional investors. According to the latest data, the asset has recorded massive inflows of $35 million on a weekly basis, primarily driven by the growing interest in spot ETFs.
This capital injection is not an isolated event. Indeed, other altcoins like XRP have recorded substantial inflows. Furthermore, this accumulation is accompanied by strategic positioning from whales in the derivatives market, with significant volume on Futures. Despite a relatively neutral 24 hour variation, this quiet accumulation suggests that a major move is brewing behind the scenes, ready to catch traders off guard.
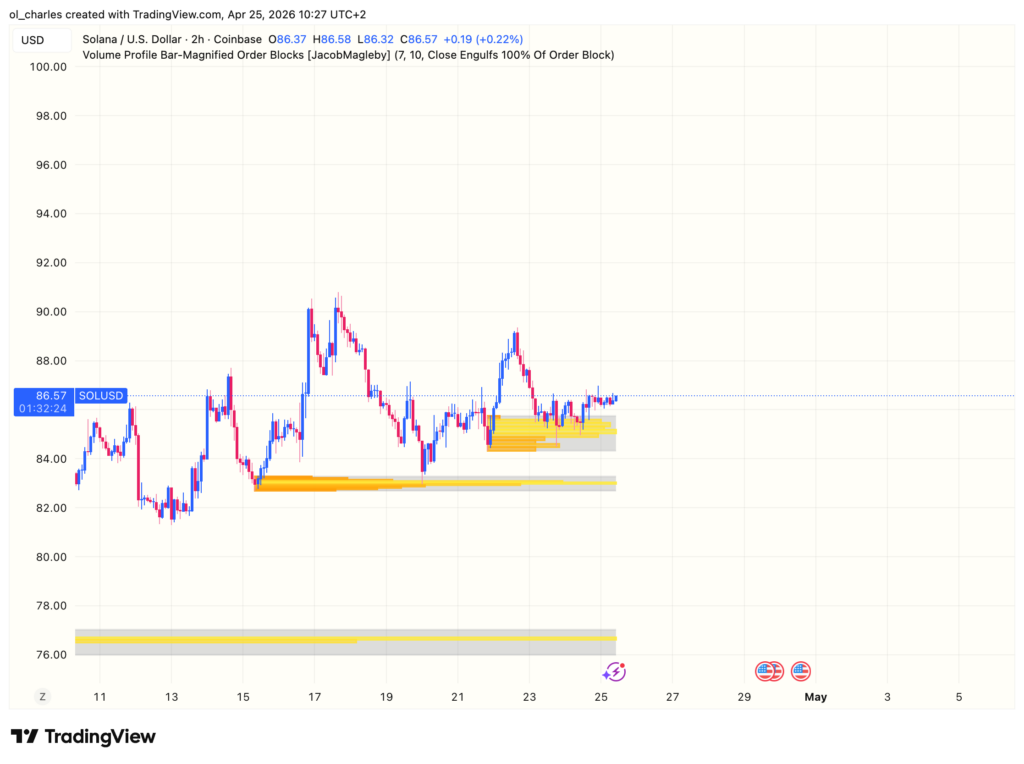
The technical analysis of Solana reveals a particularly tense setup. The current price is attempting to hold its critical support located around $85, represented by a 2H order block. If this key level is successfully defended by buyers, it could serve as a launchpad for a new retest of $92. Momentum indicators, such as the RSI (Relative Strength Index), show that the asset is trending in neutral territory, confirming the current apathy in the altcoin market.
However, immediate resistance stands at $87, followed by a major liquidity zone around $90 to $92. Breaking through these levels with sustained volume would confirm a medium term bullish scenario. The recent inflows of $35 million offer some hope, but this influx could also serve as exit liquidity for smart money.
Conversely, in the event of a breakdown below the $85 support, a deeper correction could trigger a retracement toward the $82 zone. This bearish scenario would force traders to reassess their long positions. Open Interest on Futures remains extremely robust, which increases the risks of volatility.
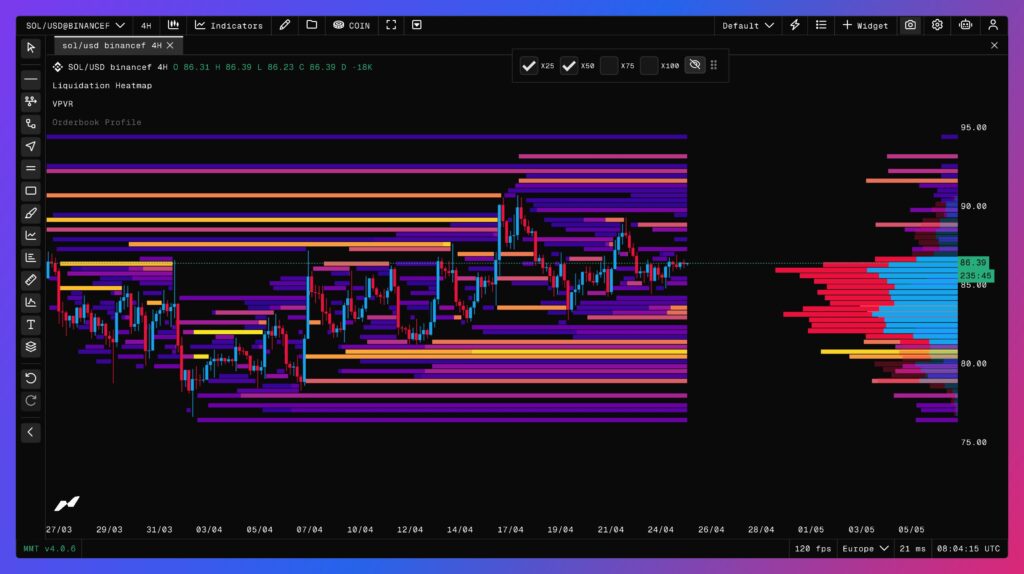
The liquidations heatmap increases the probability of a drop for SOL with a cluster at $80. Indeed, liquidity is now resting below the current price of SOL, and the max pain level is skewed to the downside rather than the upside.
Taking a step back, SOL appears to be in a bear market that could last much longer than one might expect. In fact, SOL is currently sitting in the lower part of its weekly FBB. The constant rejection at $92 from its median band confirms that this zone is now the resistance to beat. If SOL can hold $92 on a weekly or monthly timeframe, then the asset could reignite its uptrend and target $144.
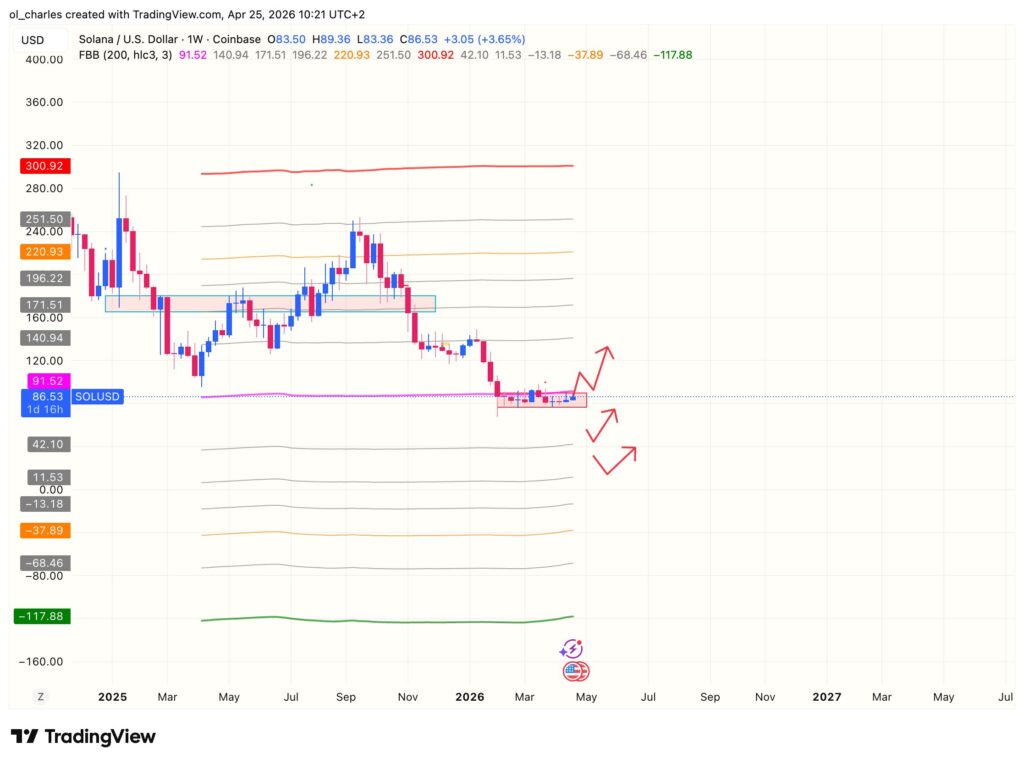
But for now, the Fibonacci levels indicate that the drop for SOL could be much deeper. Potential zones are located between $54 and $44, or in a worst case scenario, between $14 and $8. Of course, if these scenarios play out, it would take years before seeing Solana find its bottom.
To conclude, for several weeks now, a bottom has been carved out on Sundays at 10 PM. It will therefore be crucial to monitor where SOL is trading at that specific time. If SOL is positioned below $85, a short term bounce will be possible for Monday. Moving forward, as long as $92 is not broken, nothing is guaranteed for the bulls.
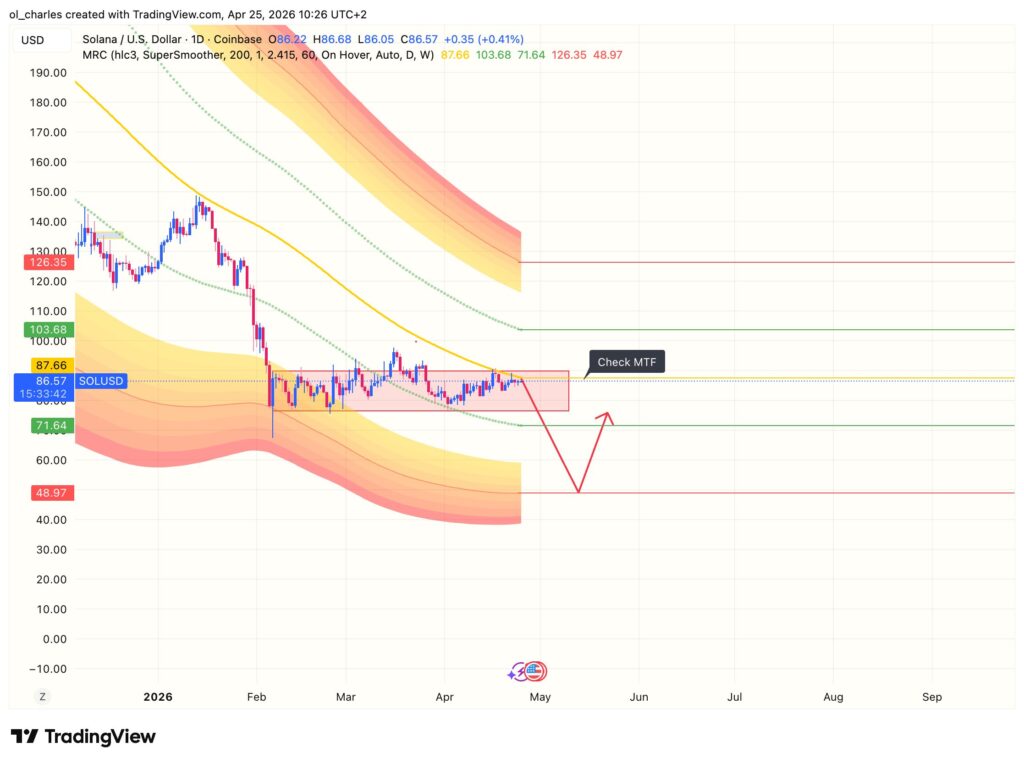
For now, as long as the $87 to $92 zone acts as resistance, a return toward $48 in the coming months remains the most likely scenario.
Sources:
Related Articles:

Charles Ledoux is a Bitcoin and blockchain technology specialist. A graduate of the Crypto Academy, he has been a Bitcoin miner for over a year. He has written numerous masterclasses to educate newcomers to the industry and has authored over 2,000 articles on cryptocurrency. Now, he aims to share his passion for crypto through his articles for InvestX.
DISCLAIMER
This article is for informational purposes only and should not be considered as investment advice. Trading cryptocurrencies involves risks, and it is important not to invest more than you can afford to lose.
InvestX is not responsible for the quality of the products or services presented on this page and cannot be held liable, directly or indirectly, for any damage or loss caused by the use of any product or service featured in this article. Investments in crypto assets are inherently risky; readers should conduct their own research before taking any action and invest only within their financial means. This article does not constitute investment advice.
Risk Warning : Trading financial instruments and/or cryptocurrencies carries a high level of risk, including the possibility of losing all or part of your investment. It may not be suitable for all investors. Cryptocurrency prices are highly volatile and can be influenced by external factors such as financial, regulatory, or political events. Margin trading increases financial risks.
CFDs (Contracts for Difference) are complex instruments with a high risk of rapid capital loss due to leverage. Between 74% and 89% of retail investor accounts lose money when trading CFDs. You should assess whether you understand how CFDs work and whether you can afford to take the high risk of losing your money.
Before engaging in financial or cryptocurrency trading, you must be fully informed about the associated risks and fees, carefully evaluate your investment objectives, level of experience, and risk tolerance, and seek professional advice if needed. InvestX.fr and the InvestX application may provide general market commentary, which does not constitute investment advice and should not be interpreted as such. Please consult an independent financial advisor for any investment-related questions. InvestX.fr disclaims any liability for errors, misinvestments, inaccuracies, or omissions and does not guarantee the accuracy or completeness of the information, texts, graphics, links, or other materials provided.
Some of the partners featured on this site may not be regulated in your country. It is your responsibility to verify the compliance of these services with local regulations before using them.
