

Is XRP Ready to Explode After a Historic Compression?
Currently trading around the $1.38 zone, the Ripple token is showing signs of extreme tension. On the 3 day chart, the Bollinger Bands are displaying their tightest squeeze in over a year. In technical analysis, such a squeeze is often the precursor to an imminent and particularly violent breakout.
This setup follows a period of high volatility in February, marked by a capitulation that pushed wicks into the $1.01 to $1.13 zone. Since then, the stagnation observed between March and April has literally compressed the market. Analysts are now identifying a true no trading zone located between $1.29 and $1.50, where uncertainty reigns supreme.
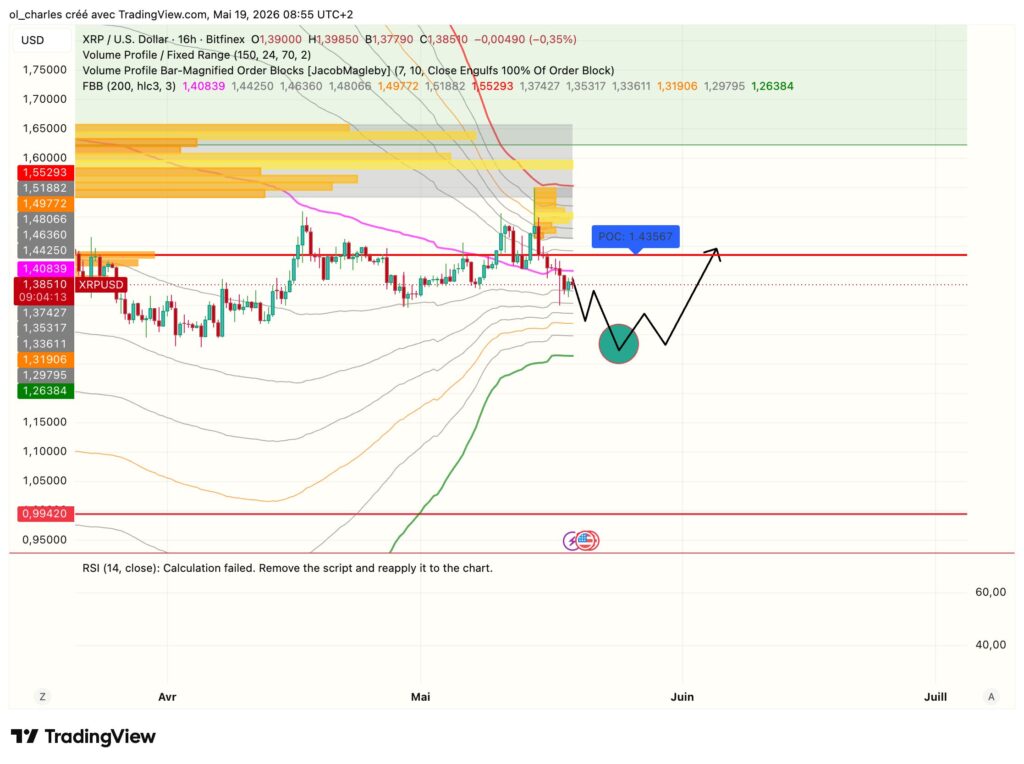
Indeed, the 16 hour FBB is also compressed. And a massive 16H bearish order block was created last week. The price is now at the lower boundary of the FBB and could return to $1.28 in the coming days before attempting a bullish bounce above the POC at $1.43.
Breakout or Correction: What Are the Scenarios for XRP?
For traders, exiting this compression zone will dictate the next major trend. In a bullish scenario, a decisive 3 day candle close above the $1.50 resistance would pave the way for a blistering rally. The main technical target would then sit around $1.80, a level that could reignite hopes for a new bull run.
Conversely, caution remains essential. If sellers take control and force a close below the critical support at $1.28, the momentum would turn resolutely bearish. Such a breakdown could trigger a deep retracement, dragging the price back toward the psychological $1.00 zone.
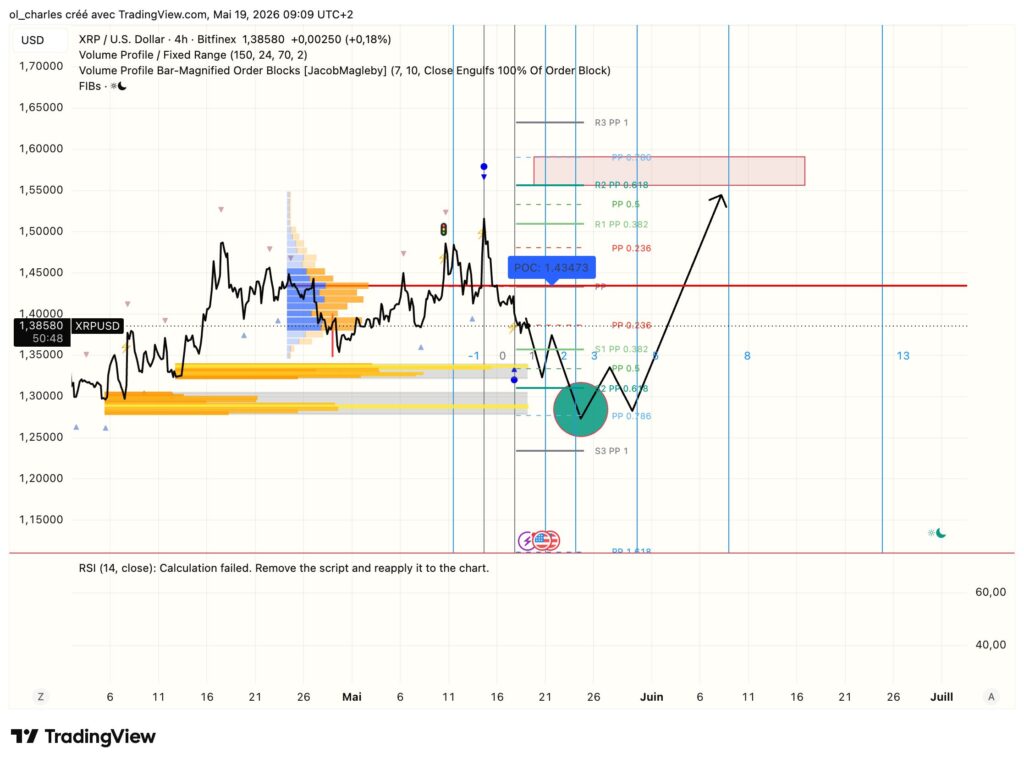
The Fibonacci pivots point to bearish targets at $1.30 and $1.27 acting as support levels for a bounce. On the flip side, XRP has its main targets in the zone between $1.55 and $1.58. The extension reaches up to $1.76 in the event of a prolonged bullish rally. For an extreme bearish scenario, the extension drops down to $1.11 as the last line of defense.
Can XRP Reignite a Massive Rally This Week?
With technical indicators stretched to the extreme, XRP is at a crossroads. Trading volumes over the next few days will be crucial to validate the direction of the breakout. Will institutional investors and whales accumulate to smash through resistance, or will we witness another market purge?
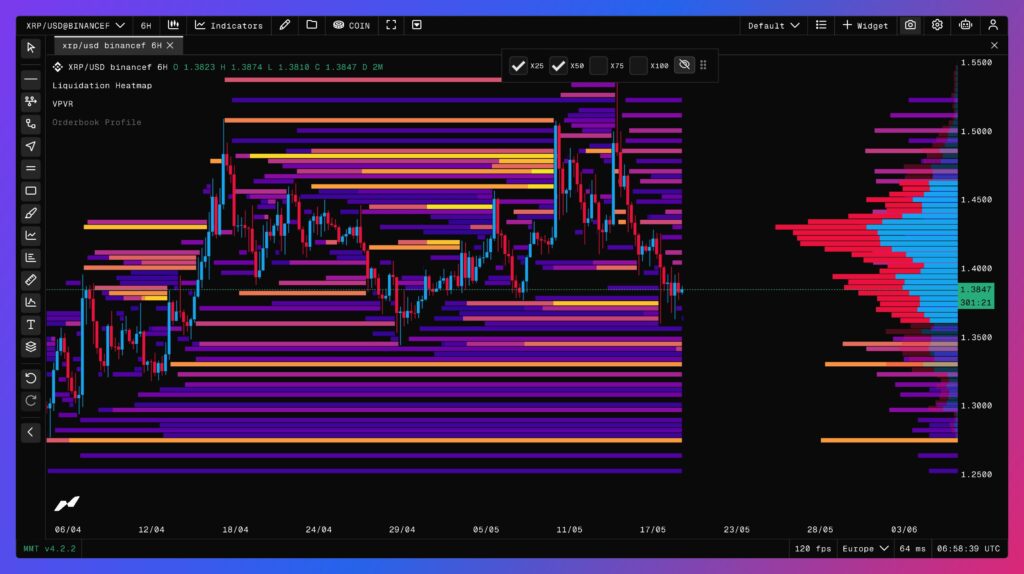
From a structural standpoint however, the token still looks bearish in the short term and the drop could extend until the end of the week. In fact, the liquidations heatmap shows two clusters still present to the downside at around $1.33 and $1.2751. These two levels have an increasing probability of being liquidated as long as the price fails to reclaim $1.43.
While the rest of the crypto market watches closely, breaking the $1.50 mark could very well be the highly anticipated buy signal. But how low can the XRP price fall before it can push for this resistance?
In any case, a rally this week seems unlikely, but the bottom is near for the short term. It will be necessary to monitor the mentioned levels and pay close attention to potential RSI divergences on the 2 hour and 4 hour charts.
For now, the stock market remains under pressure and volatility should still be highly present over the coming days. Furthermore, the HTF bearish order block on XRP is weighing on the price. For a breakout this week, it would require a major macroeconomic catalyst .
Sources:
Related Articles:

