

Home
chevron
News
chevron
Ethereum
chevron
Ethereum: Volatility at lowest level, rally towards $4,000?
Copié

Ethereum: Volatility at lowest level, rally towards $4,000?

Ethereum's volatility is at a 2-year low. Could this rare signal predict a surge? Discover the technical analysis and potential for ETH to $4,000.

Written by Simon Dumoulin

Adapted by May 28, 2026 at 09:33 by Simon Dumoulin

Ethereum lumineuse flottant au-dessus d'un graphique financier brillant, visualisation de la compression des bandes de Bollinger, ondes énergétiques teal et indigo, rayons de lumière magenta, fond cristallin, visualisation de données futuriste, ultra-précis, éclairage cinématographique
Copié

A Historically Rare Volatility Signal

The implied volatility index of Ethereum has just dropped to 48, according to data from Amberdata. This level has not been reached since early 2024. The historical volatility over 10 weeks stands at 33.19, matching the lows recorded two years ago. The weekly Bollinger Bands are in maximum contraction, a signal that few retail traders are actively monitoring.

The precedent from January 2024 is enlightening. When volatility hit 45, ETH was trading around $2,230. In 2.5 months, the price reached $4,170, representing a +87% increase. Volatility then surged back to 73, confirming the classic pattern: compression, accumulation, expansion, followed by a significant rise. This cycle has repeated with striking regularity during the last two bull runs.

The systemic dimension strengthens the analysis. Bitcoin simultaneously shows a DVOL close to 35. The simultaneous compression of the two largest cryptocurrencies by market capitalization increases the statistical probability of a coordinated violent movement. Both assets appear to be preparing together for a major directional expansion.
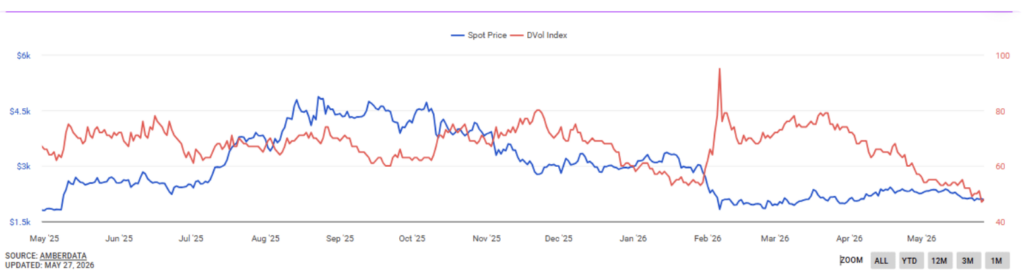
Ethereum DVol Index vs Spot Price May 2025 – May 2026, Implied Volatility at Lowest Level — Amberdata
Source: Amberdata

Technical Structure: Key Levels and Zones

For over 12 months, Ethereum has been consolidating above the $1,900-$2,000 zone. This prolonged lateral movement is not a structural weakness. It is typical behavior of institutional accumulation before a new cycle. Strong hands do not buy in euphoria they accumulate in general indifference.

The immediate support/resistance to watch is between $1,920 and $1,950. This zone represents a confluence between the Fibonacci retracement of 0.786 and the former resistance turned support. If this level is broken, the critical support at $1,850 would correspond to the last floor before a deeper shakeout. The weekly RSI is hovering around 45-48, neutral, with no overextension in either direction.

On the upside, the pivot resistance is positioned at $2,150-$2,200, which is the median band of the weekly Bollinger Bands. A weekly close above this level would trigger algorithms and swing trading breakouts. The 50 and 200 EMA on the monthly remain bullish. The zones $2,500-$2,800 represent the first acceleration target, with no major intermediate resistance identifiable.
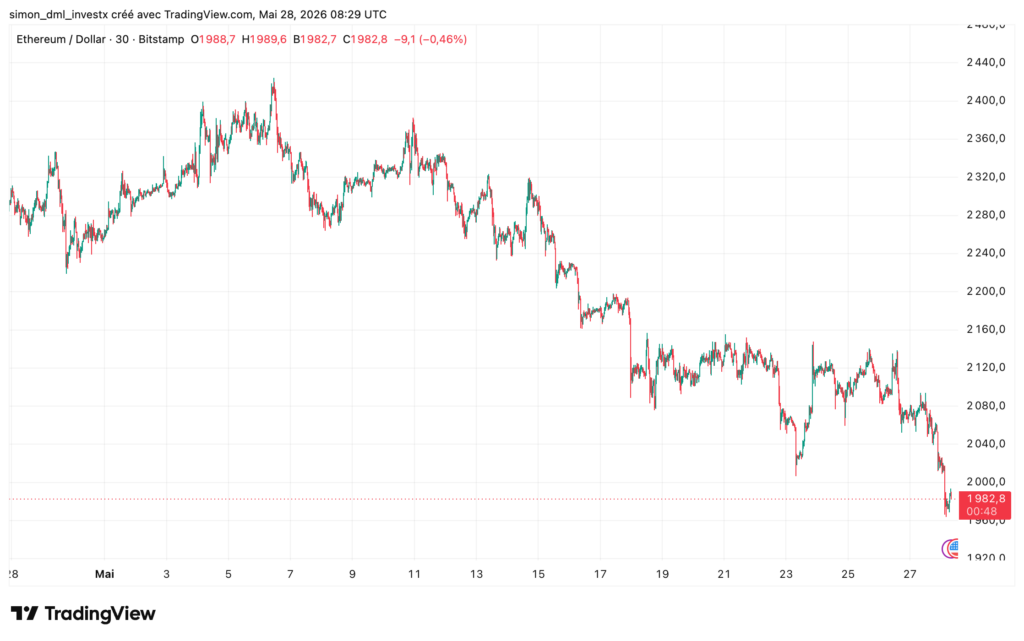
ETH/USD 30min Bitstamp — pullback to $1,982 after $2,440 peak in May 2026 — TradingView

Fundamental Context: Why the Situation is Divisive

This volatility compression cannot be analyzed outside the tense fundamental context surrounding ETH. David Hoffman, co-founder of Bankless, has sold all of his ETH. His thesis is clear: Ethereum has succeeded technologically but has failed to establish ETH as a currency. The layer 2 solutions have scaled the network but capture value at the expense of the native token.

The ETH/BTC ratio has hit new lows around 0.027, with 13 consecutive red candles over three days. This has never been seen in the history of the ratio. These signals indicate a structural rotation towards assets with more direct value capture like Solana, Near Protocol, or Arbitrum. An asset can underperform its sector and still rebound strongly in absolute value simultaneously.

However, the network fundamentals remain strong. Over $250 billion in stablecoins are deployed on Ethereum. DeFi activity is at record levels on L2. The staking shows 3,394,545 ETH queued against only 64 ETH waiting to be unstaked, a structural imbalance of 53,000x favoring supply scarcity.

ETH at $4,000: What Scenarios are Realistic?

Three scenarios shape the Ethereum forecast for the medium term. The bullish scenario relies on a breakout: volatility explodes on favorable macro conditions, a Fed decision, positive Bitcoin ETF data, or a geopolitical agreement. A weekly close above $2,200 would trigger algorithms. The realistic target by the end of 2026 is between $3,800 and $4,500 if the ETH/BTC ratio stabilizes.

The shakeout scenario remains classic before a strong recovery. A drop below $1,920 with volume would sweep liquidity towards $1,760-$1,850. This would be the last trap for bears, liquidating impatient long futures before a violent rebound. The $1,800-$1,850 zone would then represent the most favorable entry of the cycle for a long-term HODL.

The base scenario remains the most probable in the short term: consolidation between $1,850 and $2,300 during the summer, with an explosive breakout expected in the autumn. A regulatory catalyst or a favorable tech earnings season could play this role. This is the “patience rewarded” scenario, perfectly aligned with the current crypto trend dynamics in institutional markets.

Sources:

Related Articles:

Simon Dumoulin

Simon Dumoulin

Crypto analyst with over 7 years of trading experience and a strong background in the iGaming and cryptocurrency industries, I cover crypto news with a rigorous yet accessible approach. Passionate about blockchain since 2019, I have published more than 1,200 articles and guides on cryptocurrencies, DeFi, and blockchain, recognized for their reliability and clarity.

Specializing in on-chain trading and whale activity analysis, I decode blockchain flows to anticipate market trends before they become obvious.

One of my articles was cited by Éric Larchevêque, co-founder of Ledger, highlighting the quality and credibility of my analysis.

My goal remains unchanged: to make crypto accessible and understandable for everyone, from beginners to experienced investors.

Follow me on LinkedIn and X to stay updated with my latest insights.

DISCLAIMER
This article is for informational purposes only and should not be considered as investment advice. Some of the partners featured on this site may not be regulated in your country. It is your responsibility to verify the compliance of these services with local regulations before using them.

DISCLAIMER

This article is for informational purposes only and should not be considered as investment advice. Trading cryptocurrencies involves risks, and it is important not to invest more than you can afford to lose.

InvestX is not responsible for the quality of the products or services presented on this page and cannot be held liable, directly or indirectly, for any damage or loss caused by the use of any product or service featured in this article. Investments in crypto assets are inherently risky; readers should conduct their own research before taking any action and invest only within their financial means. This article does not constitute investment advice.

Risk Warning : Trading financial instruments and/or cryptocurrencies carries a high level of risk, including the possibility of losing all or part of your investment. It may not be suitable for all investors. Cryptocurrency prices are highly volatile and can be influenced by external factors such as financial, regulatory, or political events. Margin trading increases financial risks.

CFDs (Contracts for Difference) are complex instruments with a high risk of rapid capital loss due to leverage. Between 74% and 89% of retail investor accounts lose money when trading CFDs. You should assess whether you understand how CFDs work and whether you can afford to take the high risk of losing your money.

Before engaging in financial or cryptocurrency trading, you must be fully informed about the associated risks and fees, carefully evaluate your investment objectives, level of experience, and risk tolerance, and seek professional advice if needed. InvestX.fr and the InvestX application may provide general market commentary, which does not constitute investment advice and should not be interpreted as such. Please consult an independent financial advisor for any investment-related questions. InvestX.fr disclaims any liability for errors, misinvestments, inaccuracies, or omissions and does not guarantee the accuracy or completeness of the information, texts, graphics, links, or other materials provided.

Some of the partners featured on this site may not be regulated in your country. It is your responsibility to verify the compliance of these services with local regulations before using them.

Get 6200 USDT with Bitget ! 🔥

Don't miss out on this offer !
Create your account now to unlock this exclusive reward
Open a Bitget account
close-link
Click Me