

The cyclical structure no one can ignore
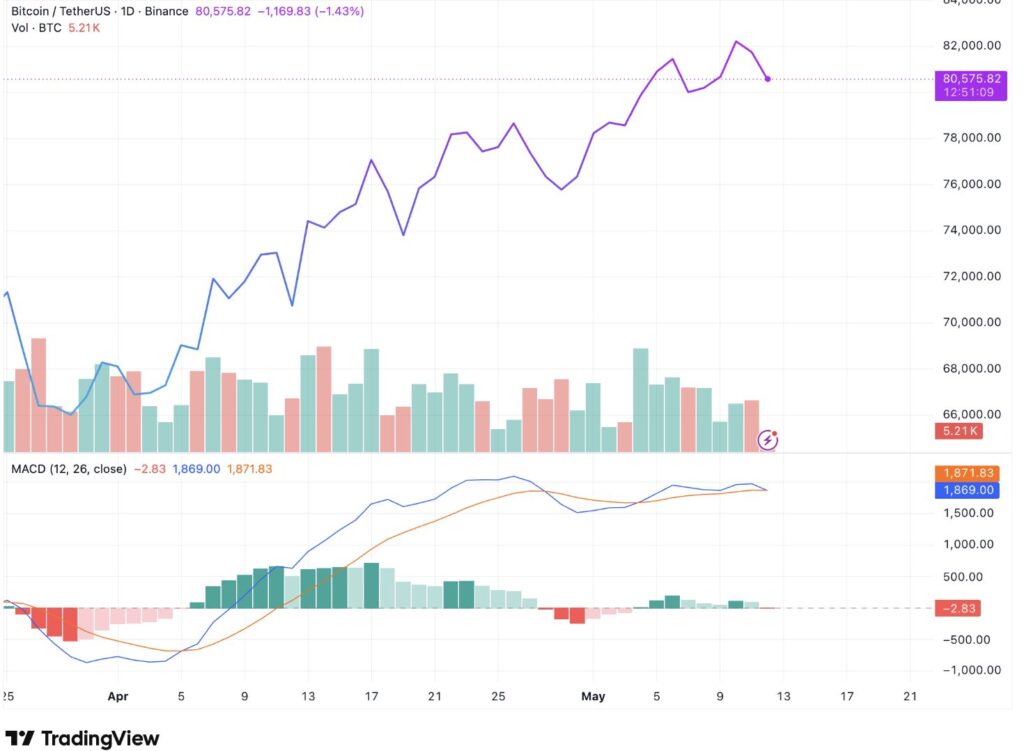
Analyst Merlijn The Trader has identified a major technical setup on Bitcoin. BTC is currently trading above $80,000, in an area well known to the 2017 and 2021 cycles. Each time, the price broke through a key resistance before suffering a brutal fakeout, liquidating the positions of overexposed traders. This bear trap then preceded the most powerful rally of the cycle.
The mechanics are always the same. Bitcoin breaks a major resistance, attracts late buyers, and then makes a brief return below support to trigger stops. Cascading liquidations amplify the short term bearish movement. Sentiment temporarily turns bearish. Then strong hands absorb the supply from panicked sellers, and the price rebounds in a violent bullish impulse.
Today, a break below $78,000 would exactly match this scenario. This level is closely monitored by traders practicing swing trading on BTC. Such a drop would not be fundamentally catastrophic, but it would mechanically trigger a wave of panic among less prepared investors. For those who understand the cyclical crypto trend, this movement would instead represent a rare accumulation window.
Fakeout or real reversal: How to tell the difference?
The distinction between a fakeout and a genuine bearish reversal relies on a few key indicators. The weekly RSI is the first filter to apply. During the 2017 and 2021 fakeouts, the indicator did not enter extreme oversold territory before the bounce. It simply corrected from an overbought zone toward its average before heading back up. A weekly RSI that stays above 40 during a correction generally validates the bear trap thesis.
The MACD on higher timeframes provides an essential complementary signal. In 2017 and 2021, the histogram bars did not flip into deep negative territory during the fakeout. Bearish momentum remained contained. If this setup repeats today, it is the most reliable signal that the correction is temporary. Experienced traders in technical analysis use precisely this RSI/MACD combination to filter out false bearish signals.
The open interest on Bitcoin futures contracts is the third element to monitor. A fakeout is usually accompanied by a brutal drop in open interest, a sign that short positions are closing massively after being liquidated. This flush of shorts creates the conditions for a short squeeze that propels the price upward. Platforms like Bybit and Hyperliquid publish this data in real time, allowing informed traders to spot the signal before it becomes visible on the price chart.
$242,000: Bold projection or realistic target?
The projection of Merlijn The Trader to $242,000 is based on a simple and historically consistent method. By applying the amplitude of post fakeout movements from previous cycles to the current structure, the analyst extrapolates a target consistent with the exponential nature of Bitcoin bull runs. In 2017, BTC multiplied by 20 from its fakeout point. In 2021, the multiplier was around 5. The $242,000 target fits into this logic of diminishing yet still powerful cycles.
The Fibonacci levels projected from the current cycle point to extensions between $200,000 and $250,000 on higher timeframes. These zones coincide with the projections of several on chain models tracked by Glassnode analysts. The Stock to Flow model and realized value indicators also converge toward similar targets for the end of the current cycle. The most serious Bitcoin forecasts fall within this range without excessive speculation.
Holding firmly above $82,000 would even invalidate the fakeout thesis and directly open a phase of vertical expansion. In this case, the market would skip the purge stage and head straight toward the first major resistances above $90,000. For altcoins like Ethereum, Solana, or XRP, a Bitcoin surging to new highs would be the catalyst for a widespread crypto bull run across the entire market.
Will Bitcoin offer one last buying opportunity in 2026?
The honest answer is that no one can predict with certainty whether the fakeout will happen. What the history of cycles teaches us is that these structures repeat because human psychology does not change. Fear and greed always produce the same mass behaviors, and crypto whales know how to exploit these emotions to accumulate before major impulses. Vigilance is therefore the most rational stance in the coming weeks.
For investors looking to invest in crypto through Bitcoin with a medium term logic, a scaled entry strategy on support zones remains the most suitable approach in this uncertain context. Spreading purchases between $78,000 and $82,000 allows you to average your entry price without trying to perfectly time the bottom. Securing your BTC on a Ledger immediately after purchase remains a basic precaution, regardless of the setup. Platforms like Binance, Coinbase, and Kraken offer the necessary liquidity to execute this type of strategy without friction.
Our take: the scenario presented by Merlijn The Trader is technically solid and historically documented. It is not a fanciful projection, but a rigorous reading of past cycles applied to the current structure. The fear and greed index and on chain data suggest that the market has not yet reached the euphoria levels characteristic of cycle peaks. The crypto trend remains structurally bullish. A fakeout would be painful in the short term, but would likely represent one of the last opportunities to buy Bitcoin before the cycle truly takes off.
Sources:
- MerlijnTrader on X
- TradingView
- Cointelegraph on X
Related Articles:

