Is the Bitcoin and Ethereum rally over? Market analysis
Is the crypto rally cooling? Explore Bitcoin & Ethereum's potential end, stablecoin supply, whale activity, and technical analysis. Click to learn more!


Is the crypto rally cooling? Explore Bitcoin & Ethereum's potential end, stablecoin supply, whale activity, and technical analysis. Click to learn more!
The cryptocurrency market is going through a phase of absolute paradox. While the total market capitalization hovers around $2.72 trillion, the supply of stablecoins has reached a massive level of $322 billion.
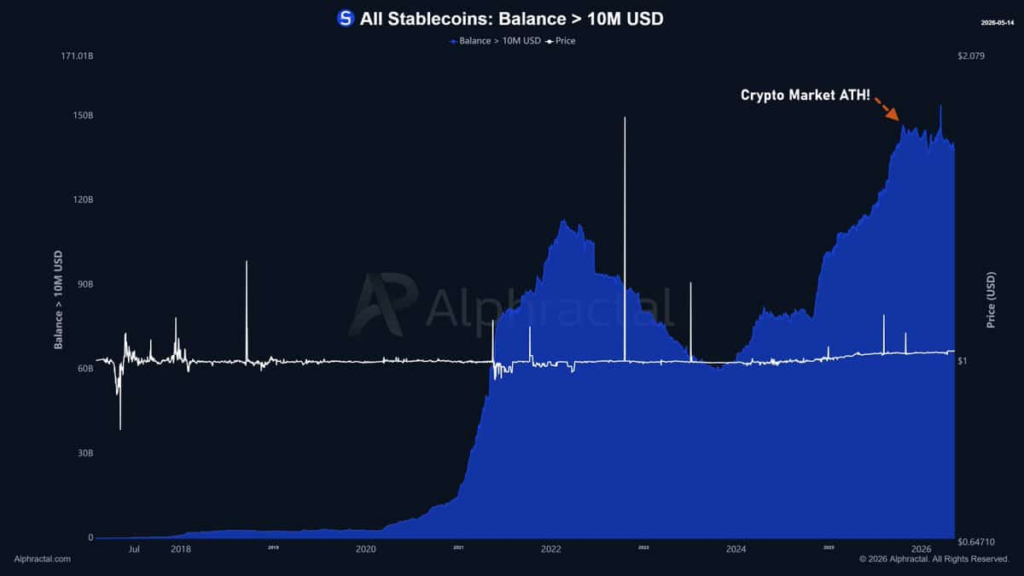
Indeed, data from Alphractal reveals that the stablecoin balance held by whales has not moved since the 2025 peak. This indicates that whale capital is not flowing into cryptos and is either sitting on the sidelines or repositioning elsewhere.
This ever increasing stablecoin supply, while Bitcoin has been dropping since 2025, therefore points to a reallocation toward markets other than Bitcoin and cryptocurrencies.
In this context, Bitcoin (BTC) is undergoing another retracement today, slipping below $79,000. Meanwhile, Ethereum, the leader and barometer for altcoins, has dropped below $2,200. These large holders seem to be distributing their assets rather than accumulating, suggesting that an immediate breakout is still too premature.
Technical analysis on Ethereum shows obvious signs of weakness. Renowned analyst Ali Martinez (@ali_charts) recently highlighted the appearance of a weekly sell signal on the TD Sequential indicator. This bearish signal has historically preceded significant retracement phases for the dominant altcoin.
If selling pressure intensifies, ETH could lose its critical support at $2,100, which represents the bottom of its multi year range. In a bearish scenario, the next price targets sit at $1,900, and potentially $1,565 if the correction worsens. Conversely, to invalidate this trend, buyers must absolutely reclaim the weekly POC at $2,352.
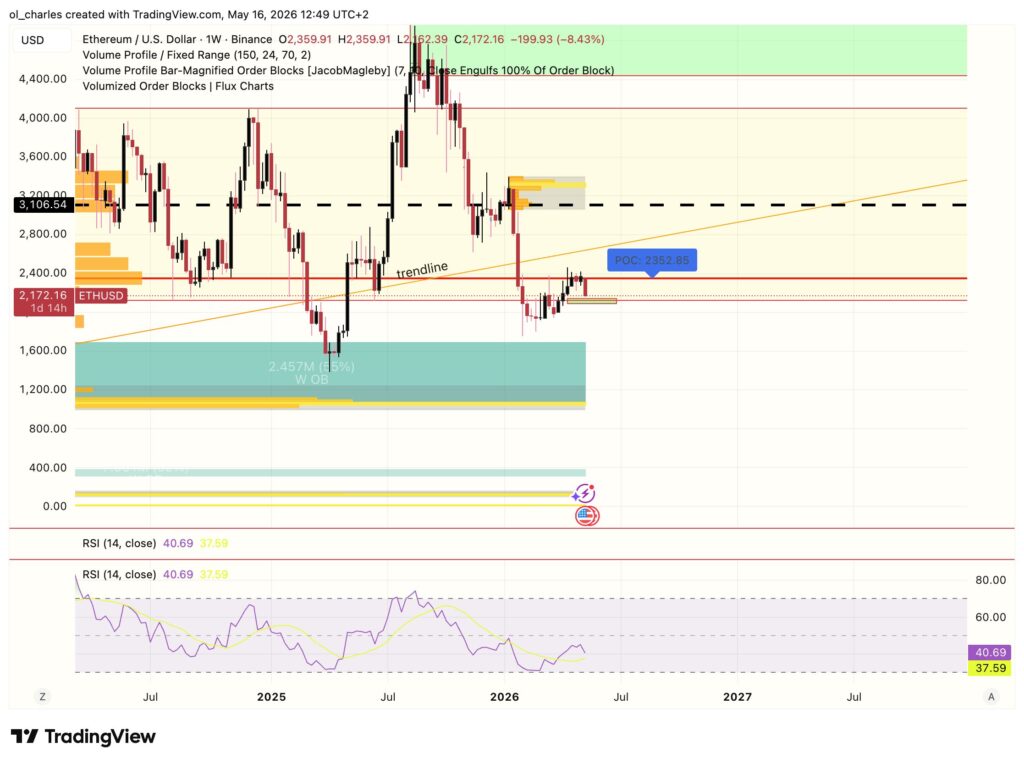
For now, losing the weekly POC confirms that bulls lack the momentum to push ETH higher. If ETH loses $2,100, it could find itself in a long and painful downtrend. Nevertheless, the order block and the $1,500 to $1,100 area represent a major demand zone. This could prove to be an ideal area for accumulation, even though a return to $700 to $500 would increase in probability.
On the Bitcoin side, the structure remains slightly more optimistic but is hanging by a thread. Indeed, BTC has been trading within a well defined ascending channel for several weeks. Furthermore, it is still above its weekly POC at $65,000, which provides major support and maintains an overall bullish structure. As long as the key support at $65,000 holds strong on the weekly timeframe, a bounce toward the upper boundary of the channel at $86,000 remains a possible scenario.
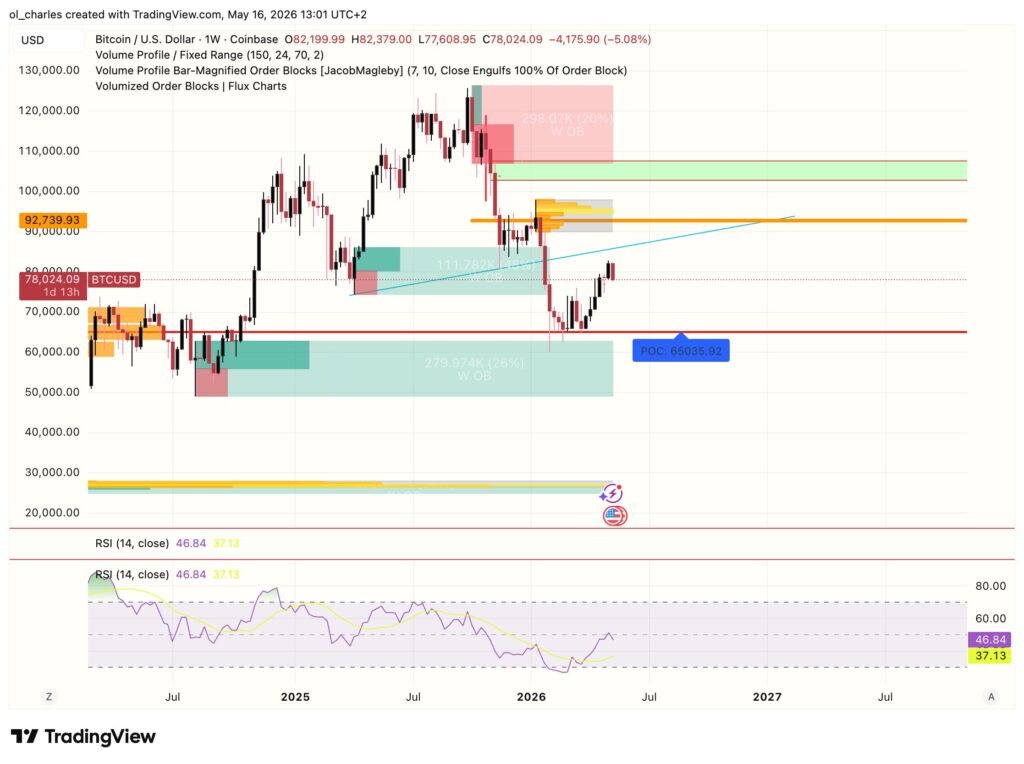
However, hesitant market sentiment and profit taking from whales could trigger a false start. A breakdown below $75,000 would invalidate the short term bullish momentum, exposing Bitcoin to a drop toward $65,000 to $70,000. According to Fibonacci, Bitcoin has crucial supports at $71,000 and $69,000 to find a local bottom if the 75k level is lost in the coming days.
Despite the abundance of liquidity materialized by these $322 billion in stablecoins, the market seems to need a consolidation phase. Capital is ready to be deployed, but institutional investors are waiting for a clear signal before triggering the next surge.
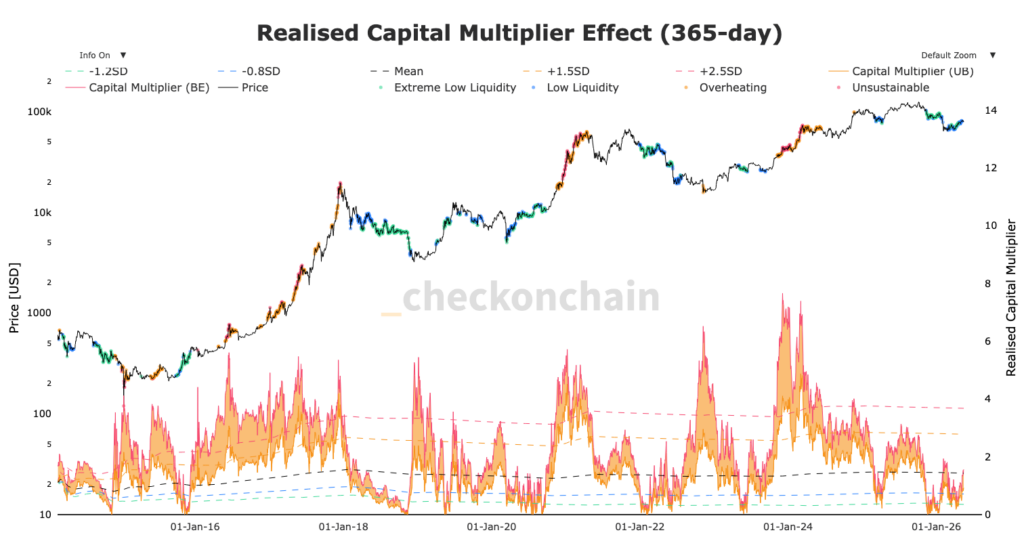
Finally, the Realized Capital Multiplier Effect chart indicates that Bitcoin remains in low liquidity territory, even though it is flirting with the average zone. But when looking at the two previous bear market bottoms, the RCME indicates a peak with extreme liquidity, signaling massive accumulation at the lows. For now, this is far from being the case for Bitcoin.
But if on chain indicators reverse and whales resume their accumulation, BTC could quickly reclaim $100,000. Conversely, a capitulation of current supports would prolong short term uncertainty.
Sources:
Related Articles:

Charles Ledoux is a Bitcoin and blockchain technology specialist. A graduate of the Crypto Academy, he has been a Bitcoin miner for over a year. He has written numerous masterclasses to educate newcomers to the industry and has authored over 2,000 articles on cryptocurrency. Now, he aims to share his passion for crypto through his articles for InvestX.
DISCLAIMER
This article is for informational purposes only and should not be considered as investment advice. Trading cryptocurrencies involves risks, and it is important not to invest more than you can afford to lose.
InvestX is not responsible for the quality of the products or services presented on this page and cannot be held liable, directly or indirectly, for any damage or loss caused by the use of any product or service featured in this article. Investments in crypto assets are inherently risky; readers should conduct their own research before taking any action and invest only within their financial means. This article does not constitute investment advice.


Risk Warning : Trading financial instruments and/or cryptocurrencies carries a high level of risk, including the possibility of losing all or part of your investment. It may not be suitable for all investors. Cryptocurrency prices are highly volatile and can be influenced by external factors such as financial, regulatory, or political events. Margin trading increases financial risks.
CFDs (Contracts for Difference) are complex instruments with a high risk of rapid capital loss due to leverage. Between 74% and 89% of retail investor accounts lose money when trading CFDs. You should assess whether you understand how CFDs work and whether you can afford to take the high risk of losing your money.
Before engaging in financial or cryptocurrency trading, you must be fully informed about the associated risks and fees, carefully evaluate your investment objectives, level of experience, and risk tolerance, and seek professional advice if needed. InvestX.fr and the InvestX application may provide general market commentary, which does not constitute investment advice and should not be interpreted as such. Please consult an independent financial advisor for any investment-related questions. InvestX.fr disclaims any liability for errors, misinvestments, inaccuracies, or omissions and does not guarantee the accuracy or completeness of the information, texts, graphics, links, or other materials provided.
Some of the partners featured on this site may not be regulated in your country. It is your responsibility to verify the compliance of these services with local regulations before using them.
