

Bitcoin at a Crossroads : Market Update
For several weeks, Bitcoin had been steadily climbing, driven by a generally bullish sentiment in the markets. However, since this weekend, this momentum seems to be waning as the price tests a well-defined resistance — a technical limit structured by both a historical trend channel and significant volumes traded at this level.
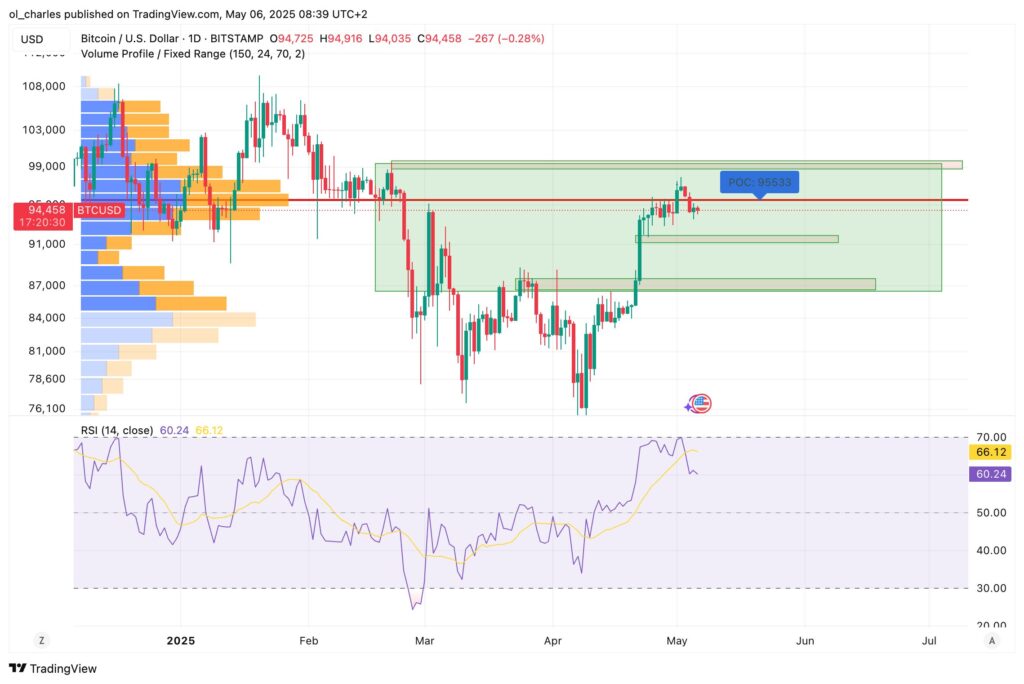
For investors and traders, understanding these technical resistances is essential to anticipate trend reversals, especially in such a volatile market as cryptocurrencies.
Three Technical Signals Questioning Further Upside
Technical analysis of Bitcoin reveals three major factors shaping a short-term reversal dynamic:
- Top Channel Resistance: A Structural Ceiling
Since late 2024, BTC has been moving within an ascending channel. The recent price rejection right at the upper level of this channel is a classic signal of a ceiling. Such configurations often act as natural reversal points in chart analyses. - November 2024 Point of Control (PoC):
The “Point of Control” (red line on the chart) — the price level with the most traded volumes over a given period — is currently acting as a barrier. This level, derived from a range seen in November 2024, attracts selling orders and becomes a battleground between bulls and bears.
In the French context, it equates to a classic psychological resistance on regulated markets, similar to moving averages on CAC 40 stocks. - Activation of a Bearish Harmonic Pattern “Shark”:
A Shark harmonic pattern has just been activated in the current resistance zone. These patterns, widely used by seasoned technical analysts, rely on Fibonacci relationships to anticipate trend reversals. A bearish confirmation would occur upon breaking the support at $91,648, a level that is still holding (for now).
Bearish Target for Bitcoin : Are $86,000 in Sight ?
If the $91,600 support breaks with sufficient volume, the scenario of a correction down to $86,000 becomes plausible. This would correspond to a natural retracement after a swift rise, leaving little technical support below.
In essence, the market could trigger a wave of stop-loss liquidations, initiating a deeper corrective move.
According to Zoral, a drop below $86,000 would instead indicate a new low in the following weeks.
Another indicator pointing towards a retracement is the daily RSI struggling to breach the 70 threshold. As Tony The Bull demonstrates on X, when the RSI fails to surpass this level, it often leads to a strong correction or a bear market:
“Bitcoin’s daily RSI has not exceeded 70, a key element for a bullish impulse. This latest failure at 70 resulted in the sharpest decline of the last bear market. In fact, the entire 2022 bear market stayed below 70.”
Nevertheless, BTC shows a bullish RSI divergence and is expected to bounce in its demand zone between $71,000 and $73,000.
What to Watch for in Bitcoin Price Evolution this Week ?
Here are the key levels to monitor for BTC this week:
- $95,200: Technical resistance level to break to reignite the bullish momentum
- $91,600: Immediate support to watch on 4H and daily closes
- $86,000: Potential target if the support breaks and a vital zone to maintain the upward trend
As long as Bitcoin remains below the upper channel zone, the probability of a correction remains high. Bulls will need to regain control quickly to avoid a scenario of prolonged consolidation.
Conversely, as long as BTC stays in the green zone on the graph above, hopes for a new high are still alive.
Bitcoin Technical Analysis : Key Takeaways
- Bitcoin is facing a high-value technical resistance
- Three indicators confirm a possible local peak
- A break of $91,600 could trigger a rapid drop towards $86,000
For analysts and institutional investors, this setup calls for special attention. Risk management becomes crucial: adjusting stops, taking partial profits, or implementing hedging positions through BTC options can be strategically relevant.

