

Bullish Signals for Pi Network
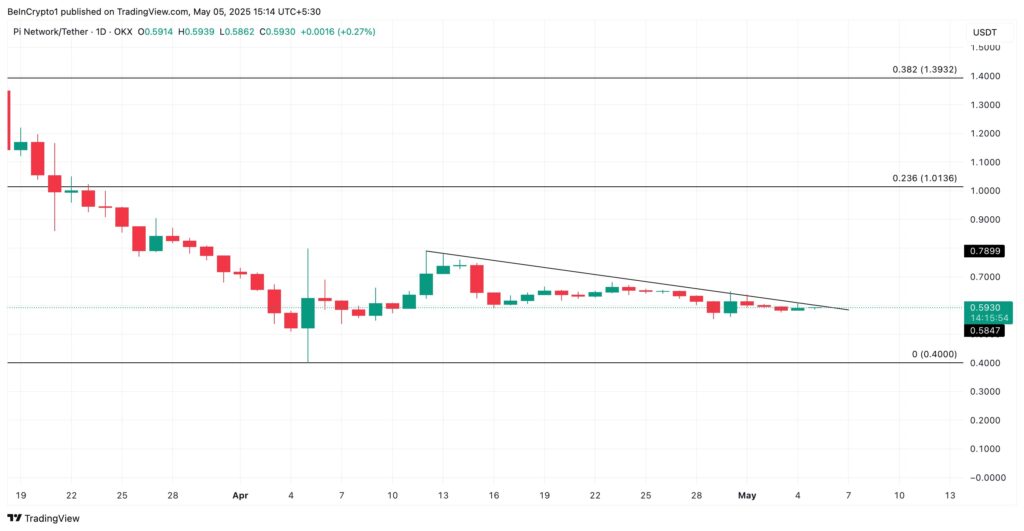
Since its historic peak at $3 in February, the Pi Network token has been caught in a downtrend. It has been moving below a descending trendline since April 12. However, recent price movements and technical indicators suggest a potential reversal of the situation.
Analysis of the daily chart for PI/USD reveals a significant increase in on-balance volume (OBV) over the past two days. This metric, considered as a leading indicator, implies an increase in buying pressure, even though the price remains stable for now. Such a divergence between price and OBV is often a precursor to an upcoming bullish breakout.
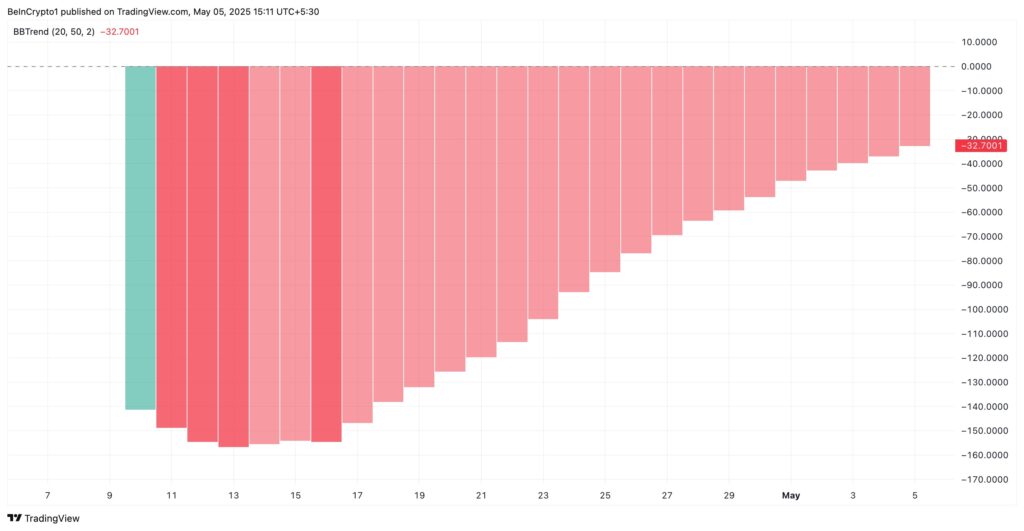
Furthermore, the red bars of Pi’s BBTrend indicator have gradually contracted, indicating a weakening selling pressure. This decrease in volatility suggests that the market is gearing up for a change in direction.
Currently trading at $0.591, the Pi token is below its downtrend line, which forms resistance around $0.605. However, if the bullish momentum strengthens and demand picks up, it could break through this level to target the $1.01 mark.
Conversely, a lack of rebound would raise concerns about a return to the historical low of $0.40.
A Potential Trend Reversal in the Making?
The technical indicators seem to indicate that the worst is over for Pi Network. The discreet accumulation by investors and the decline in selling pressure suggest a possible short-term trend reversal.
If this trend continues, the Pi token could resume its upward trend and provide excellent opportunities for traders looking for a return to $1, or even beyond. It remains to be seen if the overall sentiment in the crypto market will align with these emerging bullish signals.

