

Dogecoin +4.5% in 24h: Speculative rotation or true bullish signal?
Dogecoin is enjoying a remarkable session. Trading around $0.096, the most famous memecoin on the market is up +4.5% in 24 hours, significantly outperforming Bitcoin which is stagnating below $75,000 and Ethereum which is struggling to find momentum. This type of divergence between large caps and a memecoin is always a signal to decode carefully.
The surge was triggered by a wave of aggressive buying at the end of the Asian session, with retail participation clearly visible on the order books of major exchanges. Capital is making a clear rotation toward high speculative beta assets, taking advantage of Bitcoin’s consolidation to seek faster returns on meme coins.
This pattern is classic during an uncertain market phase. When BTC is not moving, a portion of retail capital migrates to altcoins and memecoins to generate short term performance. DOGE, with its deep liquidity and mainstream awareness, is always one of the first beneficiaries of these rotations. For traders following market cycles, this type of setup often precedes either a broad altcoin rally or a retail trap.
The problem: On-chain activity is not following
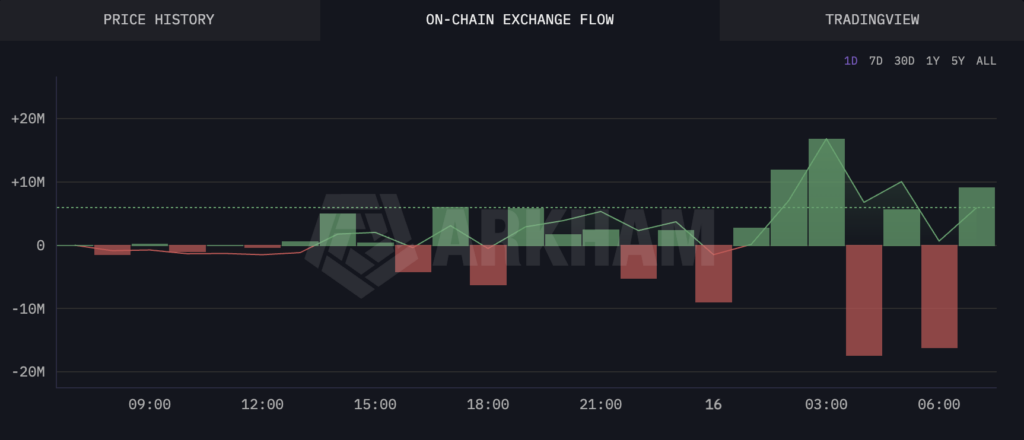
This is the signal that tempers the enthusiasm. Despite the price increase, the on-chain data of the Dogecoin network remains particularly weak. The number of active transactions, actual transfer volumes and network usage have not increased significantly over the same period. This disconnect between price action and actual usage is the typical marker of a movement fueled by derivatives speculation rather than organic demand.
Historically, DOGE rallies without on-chain confirmation have a limited lifespan. They can be extended if an external catalyst occurs (a tweet from Elon Musk, a payment integration announcement), but they quickly run out of steam in the absence of sustainable inflows. To understand how to read these signals, our section on technical analysis and fundamental analysis provides a useful framework to avoid getting trapped by this type of setup.
Technical levels to watch
The $0.088 – $0.096 zone constitutes the immediate support. As long as the price trades above this range, the structure remains technically bullish in the short term. The RSI and MACD will need to be monitored on the upcoming daily closes to confirm whether the market is overheating or if it still has room to run.
The major resistance is located at $0.104. A daily close breakout with volume would pave the way toward $0.12 initially. This is the bullish scenario. In the bearish scenario, if the $0.088 support breaks under selling pressure, long positions opened on the futures markets could face cascading liquidations, amplifying the downward movement. Traders using futures tools know that this type of chain liquidation can be brutal on an asset as volatile as DOGE.
Can Dogecoin sustainably settle above 10 cents?
The $0.10 barrier is psychologically important for DOGE. It is a round number that naturally attracts selling pressure from holders who accumulated below. For DOGE to sustainably settle there, a combination of catalysts would be needed: confirmation of a Bitcoin rally beyond $75,000, a real increase in on-chain activity, or a fundamental announcement related to the ecosystem.
As it stands, the setup looks more like a short term speculative rotation than the start of a lasting trend. Investors looking to buy Dogecoin will need to manage their risk rigorously, clearly defining their entry and exit levels before taking a position. For those who want to follow the medium term Dogecoin price predictions, the confirmation of a support above $0.096 over several consecutive sessions will be the first signal to validate.
Sources:
Related Articles:

