
How High Could XRP Price Go in October?
Amidst the bullish crypto market, XRP's ability to stay above the $3 mark is under scrutiny. Our in-depth analysis reveals key trends to optimize your XRP price strategy effectively.


Amidst the bullish crypto market, XRP's ability to stay above the $3 mark is under scrutiny. Our in-depth analysis reveals key trends to optimize your XRP price strategy effectively.
The XRP price has increased by nearly 1% over the past 24 hours, trading around $2.9886 at the time of writing. Despite this slight rebound, technical indicators show signals of a possible bearish reversal in the short term, or simply consolidation before the next rally.
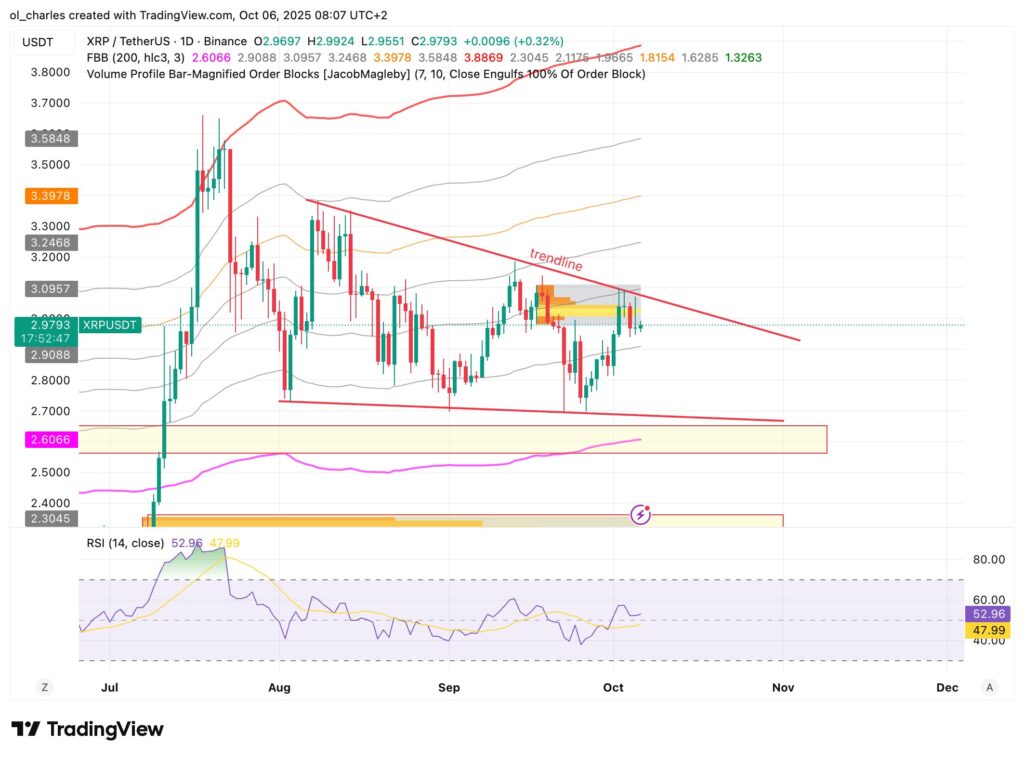
On a daily timeframe, XRP attempted to break through the liquidity zone up to $3.11, but this attempt proved to be a false bullish signal. Since then, sellers have slightly regained control. If bulls fail to defend the key level of $3.00, a correction towards the support zone of $2.82 could occur in the coming days.
On the 16-hour chart, two order blocks are visible. This signals massive accumulation. The support between $2.82 and $2.9 has a high probability of withstanding a correction.
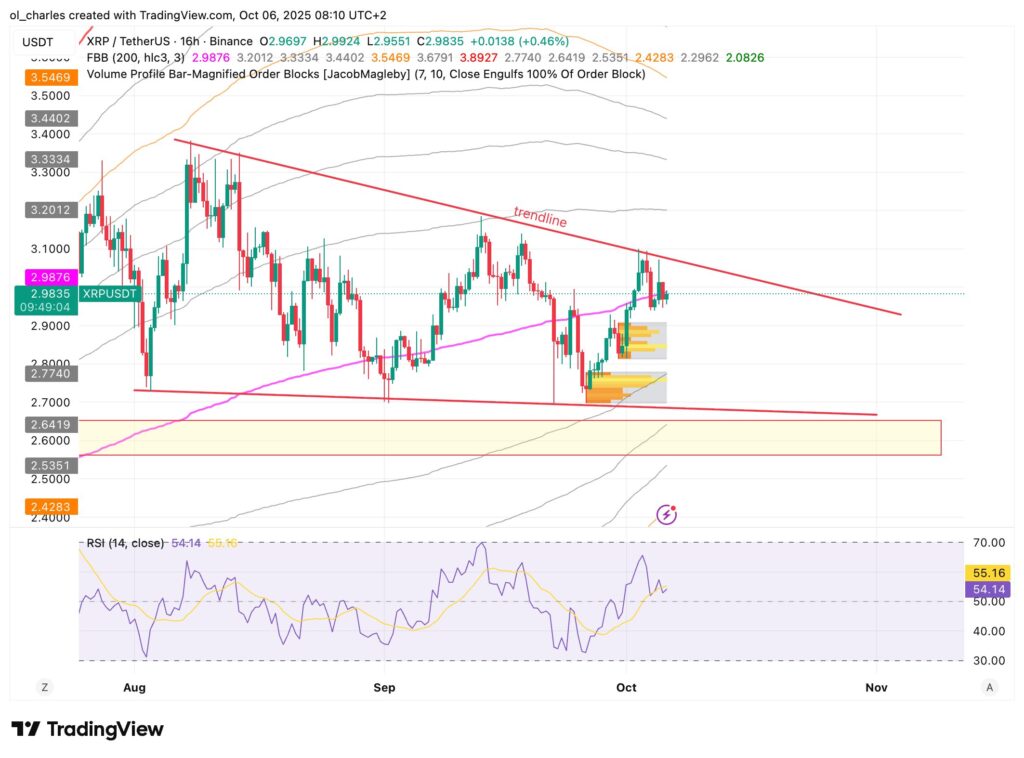
In other words, XRP could remain trapped between $3.11 and $2.82 for several days or weeks.
From a medium-term perspective, XRP is evolving in a phase of technical equilibrium, trapped between well-defined support and resistance levels. Neither camp—buyers nor sellers—seems to dominate clearly. Additionally, trading volume remains relatively low, indicating a wait-and-see market.
For active traders, a swing trading strategy may be justified as long as XRP remains in its horizontal channel. For long-term investors, maintaining above $2.80 is crucial before considering strengthening positions. The XRP price forecast currently indicates a stagnation zone before a possible acceleration.
This presents an opportunity to take advantage by accumulating before its potential rebound to $4 or even $5 in the coming months. Indeed, lateral phases like this one are often accumulation phases by whales before an explosive bullish rally.
Get $10 free when buying your XRP on Bitget easily:
From a long-term perspective, breaking through the bullish trendline and $3.11 is quite probable. Moreover, the XRP heatmap indicates a massive sell order of 1.7 million XRP at $3.17, the next resistance to watch. If this is breached, XRP will be headed for $3.6.
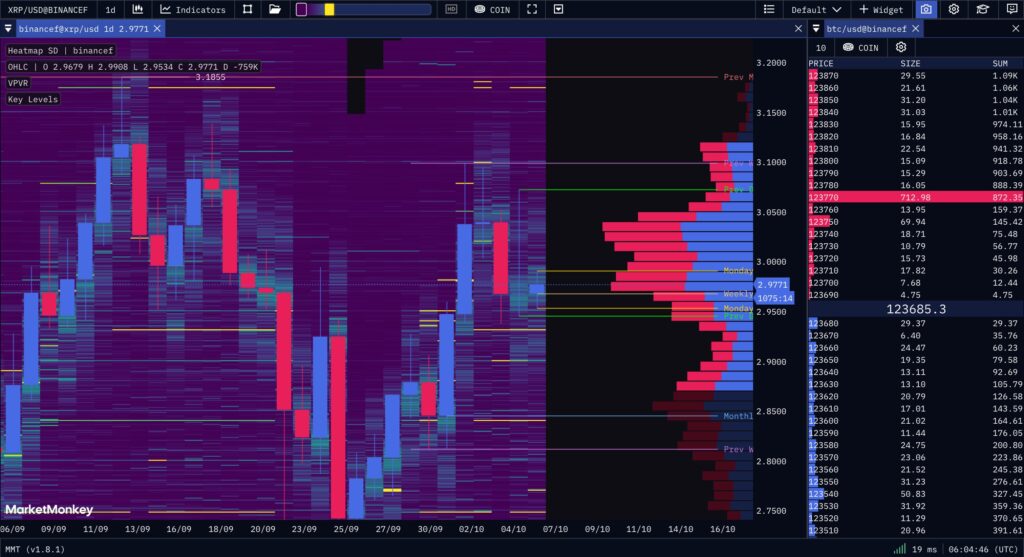
In summary, the consolidation scenario for the coin around $3 is plausible. Traders should pay particular attention to the pivot zone of $2.82, which could trigger a new impulse, bullish or bearish, depending on the direction of the breakout. As long as the trend remains neutral, caution is the mother of safety.
Related articles:

Charles Ledoux is a Bitcoin and blockchain technology specialist. A graduate of the Crypto Academy, he has been a Bitcoin miner for over a year. He has written numerous masterclasses to educate newcomers to the industry and has authored over 2,000 articles on cryptocurrency. Now, he aims to share his passion for crypto through his articles for InvestX.
DISCLAIMER
This article is for informational purposes only and should not be considered as investment advice. Trading cryptocurrencies involves risks, and it is important not to invest more than you can afford to lose.
InvestX is not responsible for the quality of the products or services presented on this page and cannot be held liable, directly or indirectly, for any damage or loss caused by the use of any product or service featured in this article. Investments in crypto assets are inherently risky; readers should conduct their own research before taking any action and invest only within their financial means. This article does not constitute investment advice.
Risk Warning : Trading financial instruments and/or cryptocurrencies carries a high level of risk, including the possibility of losing all or part of your investment. It may not be suitable for all investors. Cryptocurrency prices are highly volatile and can be influenced by external factors such as financial, regulatory, or political events. Margin trading increases financial risks.
CFDs (Contracts for Difference) are complex instruments with a high risk of rapid capital loss due to leverage. Between 74% and 89% of retail investor accounts lose money when trading CFDs. You should assess whether you understand how CFDs work and whether you can afford to take the high risk of losing your money.
Before engaging in financial or cryptocurrency trading, you must be fully informed about the associated risks and fees, carefully evaluate your investment objectives, level of experience, and risk tolerance, and seek professional advice if needed. InvestX.fr and the InvestX application may provide general market commentary, which does not constitute investment advice and should not be interpreted as such. Please consult an independent financial advisor for any investment-related questions. InvestX.fr disclaims any liability for errors, misinvestments, inaccuracies, or omissions and does not guarantee the accuracy or completeness of the information, texts, graphics, links, or other materials provided.
Some of the partners featured on this site may not be regulated in your country. It is your responsibility to verify the compliance of these services with local regulations before using them.

