

Solana : 10% Surge or 30% Drop ?
At the time of writing, Solana (SOL) is trading around $107.50, after surging by over 10% from $97 within 24 hours. While this recent increase has sparked enthusiasm, technical analysis and on-chain data suggest that SOL may face significant short-term decline.
Solana broke its crucial horizontal support of $114 on April 6, 2025, a level that historically acted as a price reversal or bounce point. However, this time, the pattern failed, paving the way for further decline.
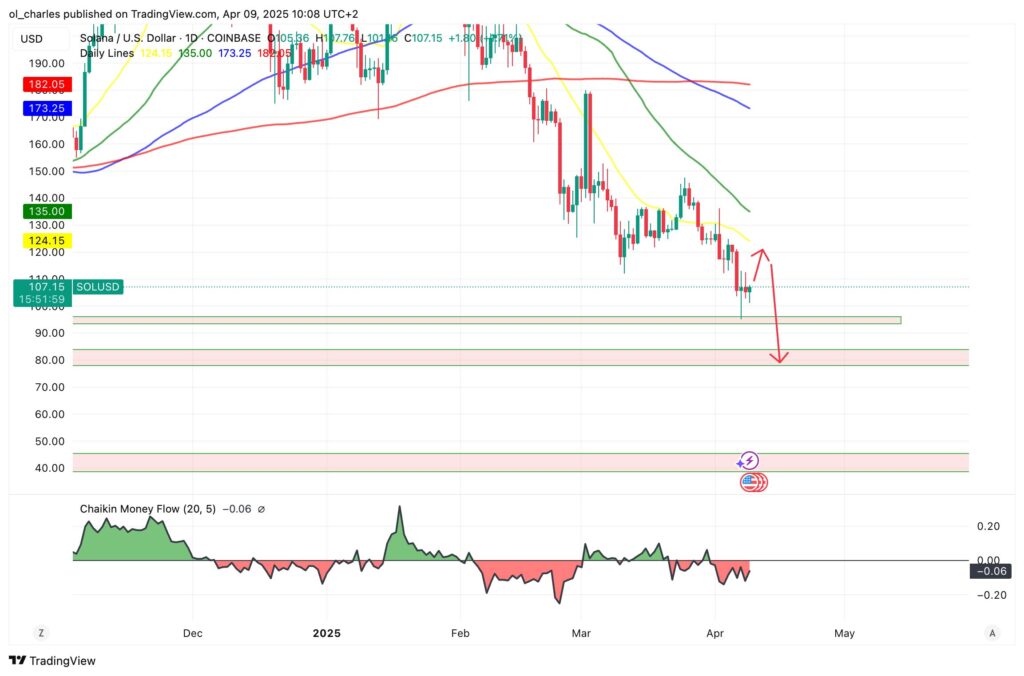
Indeed, if SOL remains below $114, historical trends indicate a potential drop of 30%, which could bring it back to its next support level at $77. Currently, SOL is trading below the 200-day moving average on the daily chart, signaling a strong downtrend with continuous downward momentum.
If Solana fails to reach $135, it will continue its drop to $80-77.
Technical Analysis and On-Chain Metrics: Bearish Signals Accumulating
On-chain metrics also confirm the bearish sentiment among traders. Coinglass data shows that traders hold more short positions than long positions in the market, with $85 million in short positions built at the $113.10 resistance level. This suggests that bears currently dominate this asset.
In summary, Solana could see an increase in the coming days up to $120 to liquidate shorts and then trend back downwards.
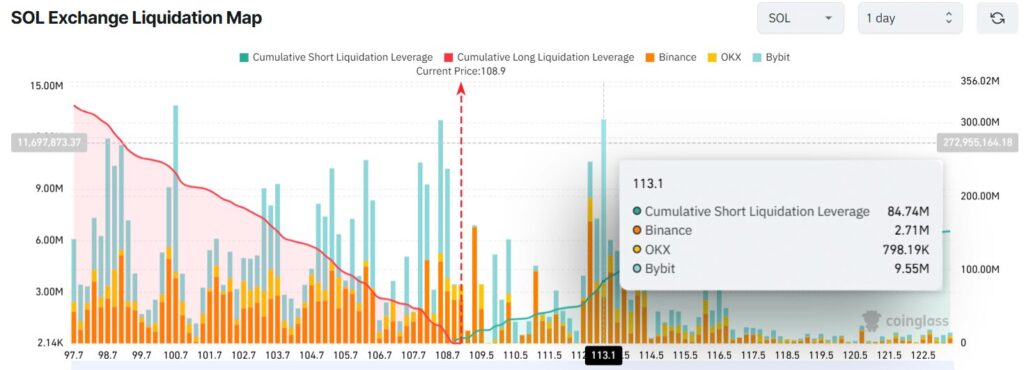
However, these short and long positions are likely to be liquidated once the price significantly moves in either direction. Hence, the support level of $77 becomes a crucial point to monitor for Solana investors, as a fallback to this level would indicate a major shift in project dynamics.

