

The Context: A Range Turning into a Trap
The market structure is clear. XRP has been consolidating for months between $1.30 and $1.38, with repeated breakout attempts in both directions that have consistently resulted in rejections. The latest episode is telling: during the session on May 27, a breakout attempt towards $1.36 mobilized over 62 million XRP before the price abruptly reversed downward. This failure volume is a signal in itself — buyers are present, but the resistance zone is absorbing attempts with tenacious efficiency.
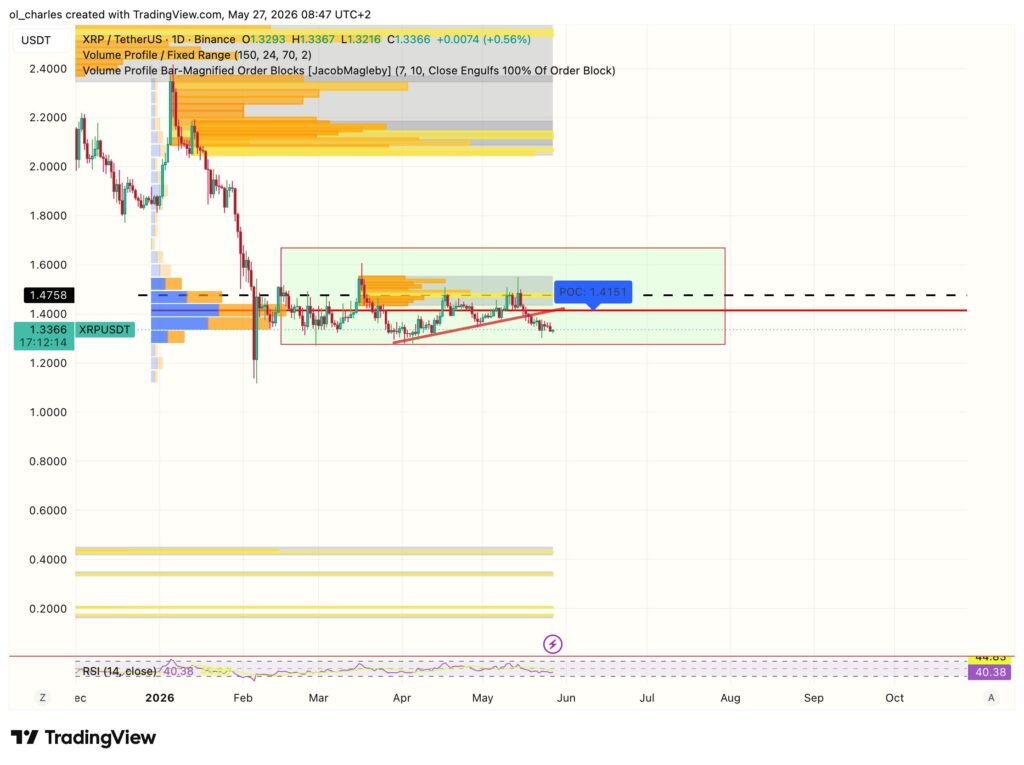
At $1.332, the price is precisely halfway in the lower part of the range. The short-term momentum is bearish. Indeed, the price has failed to reclaim the pivot level at $1.367 after the breakout, which maintains latent selling pressure in the upcoming sessions. Nevertheless, momentum is weak, the market is taking a pause, and positions are accumulating on both sides. In summary, this is exactly the setup that precedes a violent expansion and volatility.
The Liquidity Map: Two Critical Clusters Below the Range
This is where the analysis becomes strategic. Below the current price, two zones concentrate a high density of long positions in HTF and represent natural targets for liquidation for the market before any bullish reversal.
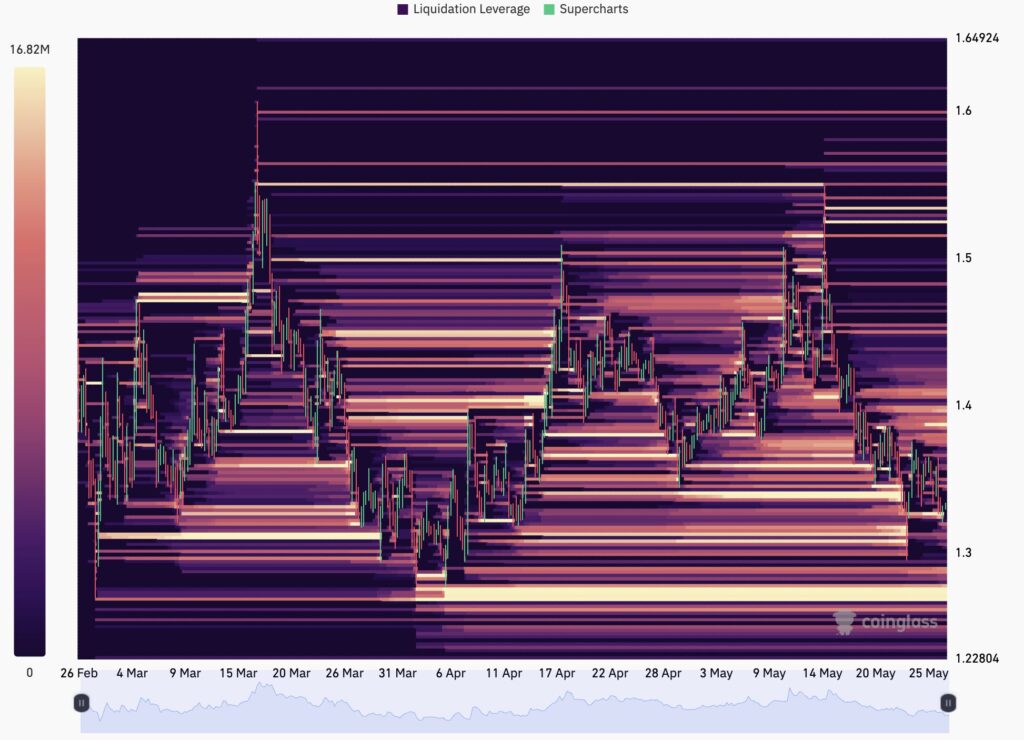
The first cluster is around $1.27 — the bottom of the long-term range. This is where the stops of traders positioned long on the support are accumulating. A density of long positions at this level creates liquidity that the market mechanically seeks to reach before reversing. The second, deeper cluster focuses around $1.23 — a level that represents an extension below the range and serves as the target for a classic deviation under structure.
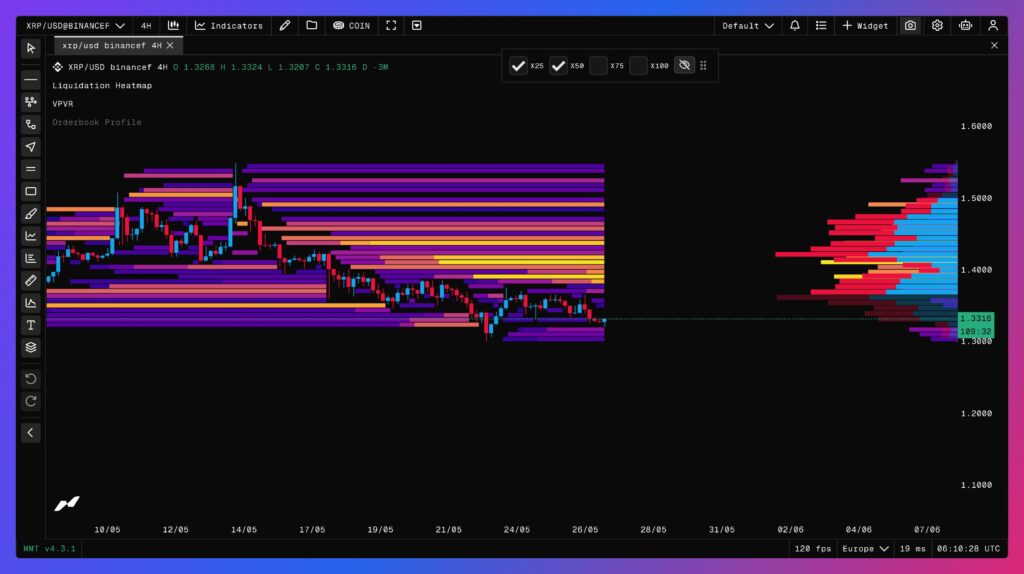
A potential drop should be monitored in the coming weeks as the rebound could be violent. A fakeout downward would allow for the liquidation of longs before seeking the shorts that are accumulating up to $1.43 in STF.
The Long Setup: How to Exploit the Range
The optimal entry scenario is built around the deviation below the range. If XRP breaks below $1.27 in the upcoming sessions and shows a quick reintegration above this level — confirmed by a closing hourly or 4-hour candle above $1.27-$1.30 — this constitutesa high-probability long entry signal.
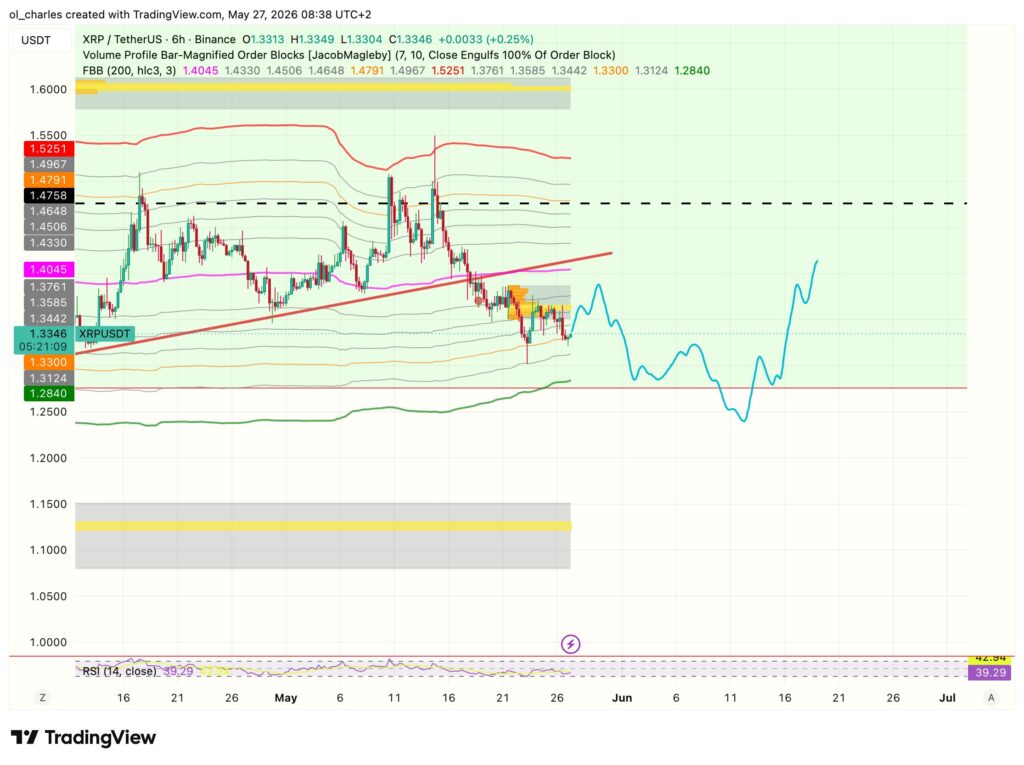
Indeed, this is a typical scenario formed by smart money. The deviation has liquidated weak hands, short sellers have been trapped by the false bearish breakout, and the price reintegrates its structure. In this context, the bias becomes structurally bullish again up to the upper resistance levels of the range.
Trade Structure:
➡️Entry Zone: $1.27–$1.30 after confirmation of reintegration
➡️Stop Loss: below $1.22 — complete invalidation of the thesis if the price settles sustainably below $1.23
➡️TP1: $1.45 — intermediate resistance corresponding to the high median of the extended range and the short-term density zone of shorts
➡️TP2: $1.60 — structural target corresponding to the complete reversal of the range and the projection of the symmetrical triangle post-breakout
➡️Risk/Reward Ratio: greater than 1:4 when entering at $1.28 with a stop at $1.22
The 6H Order Block Between $1.35 and $1.388: The Lock on the Setup
Multi-timeframe analysis reveals a major structural obstacle that any bullish scenario must overcome: the order block on the 6-hour timeframe located between $1.35 and $1.388. This zone corresponds to the last significant selling impulse — the place where institutional sellers placed their orders and turned the market.
An unbroken order block acts as a ceiling. As long as XRP does not record a convincing 6H close above $1.388, the bias remains neutral to slightly bearish in the medium term. A rejection in this zone — a scenario currently playing out with each rebound attempt — mechanically pushes the price towards the bottom of the range and fuels the deviation scenario described above.
On the other hand, a clean break of the order block with volume — ideally a 6H close above $1.40 — would radically change the reading. It would signal the absorption of sellers, free longs towards $1.45 and then $1.60 without major intermediate technical obstacles, and transform the previously trapped sellers into forced demand via their stops.
In conclusion, XRP is in a maximum compression setup with a bias that lacks a real direction for now, other than a range. The priority in the coming days is to observe the price behavior in the $1.27–$1.30 zone.
A clean deviation below this zone followed by a quick reintegration represents one of the most favorable setups in the current market for XRP, with a potential of 25% towards $1.60 and a controlled risk below $1.22. The 6H order block between $1.35 and $1.388 remains the wall to watch under all circumstances. It will determine whether XRP regains its trend or prolongs its compression.
Patience is the dominant discipline here. The market has compressed long enough for the next expansion to be significant in either direction. Set alerts on $1.27, $1.23, and $1.40, and let the price show its hand before acting.
Sources:
Related Articles:

