

XRP: Towards a Concerning Technical Breakout ?
The price of XRP has seen a remarkable evolution in the markets. On the daily chart, the cryptocurrency has now closed two consecutive candles above a significant resistance level at $2.46. This bullish breakout is an encouraging sign, confirming a clear positive trend.
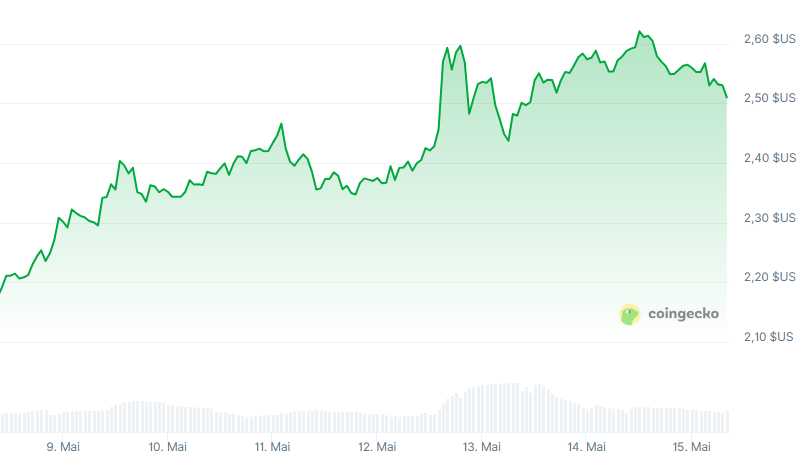
Source: CoinGecko
Despite this favorable momentum, short-term charts suggest a warning. According to analyst Josh from Crypto World, a bearish divergence has appeared on technical indicators. This means that although the price continues to rise, the Relative Strength Index (RSI) is starting to decline.
When such a divergence occurs, it typically indicates that the bullish rally could experience a temporary slowdown. Therefore, in the coming days, the XRP price could either undergo a slight correction or move sideways. However, this is not necessarily bad news. In fact, a brief cooldown can be beneficial for the market. It allows indicators like the RSI to reset and prepare for a new upward phase.
Crucial Price Levels to Watch
In case of a pullback, the previous resistance level at $2.45-2.46 should act as a strong support. On the upside, the next resistance points that traders closely monitor are around $2.60, $2.77, $2.95, $3.15, and $3.30.
For now, the overall trend of XRP remains positive, and little has changed in the last 24 hours. The market structure on the daily chart continues to look bullish, fueling hopes for additional gains in the days ahead.
While XRP seems well-positioned to continue its ascent, analysts warn of a potential temporary short-term slowdown. The key price levels to watch will be crucial in determining the market’s next moves. XRP traders and investors would do well to keep a close eye on the price development in the coming days. If you wish to invest in one of the top crypto platforms, we recommend going through Weex.

