

Technical Analysis : Mixed Signals but Overall Positive Trend
Technical observers note both signs of stability and strength in the Kaspa price movements. On one hand, the average trend index (ADX) is around 28.18, with a relative strength index of 76. This reflects a potentially overbought market susceptible to a correction. However, on the other hand, the support around $0.01 remains solid. While the resistance has shifted to the range of $0.13 to $0.15, which Kaspa is currently breaking through.
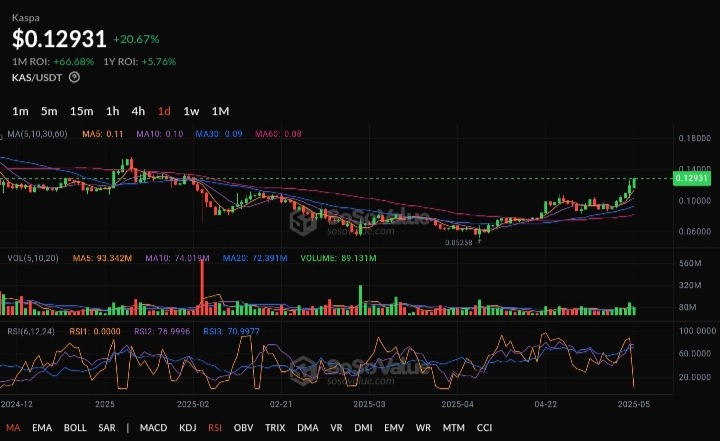
In the last 24 hours, Kaspa has surged by nearly 9% to reach $0.120, grabbing traders’ attention. Current forecasts suggest that the cryptocurrency could reach $0.155 in the next five days, representing a potential 32% increase from current levels. Moreover, 19 bullish days in the last month and a convergence of major moving averages support this positive momentum.
What is the Value of a $1,000 Investment in Kaspa ?
For traders considering a position, an investment of $1,000 today could yield $1,320 if the bullish forecast materializes. In case of price stagnation, the investment could remain unchanged, but a swift correction is not to be ruled out if momentum is lost.
As Kaspa heads towards a price level of $0.155, its ability to sustain this upward trajectory will depend on breaking through the resistance barriers at $0.13 and $0.15. The upcoming days will be crucial in determining whether Kaspa can continue its bullish momentum or if a correction is on the horizon. Stay tuned to track the progress of this promising cryptocurrency.

